Estimated Value: $465,000 - $526,000
3
Beds
3
Baths
2,597
Sq Ft
$191/Sq Ft
Est. Value
About This Home
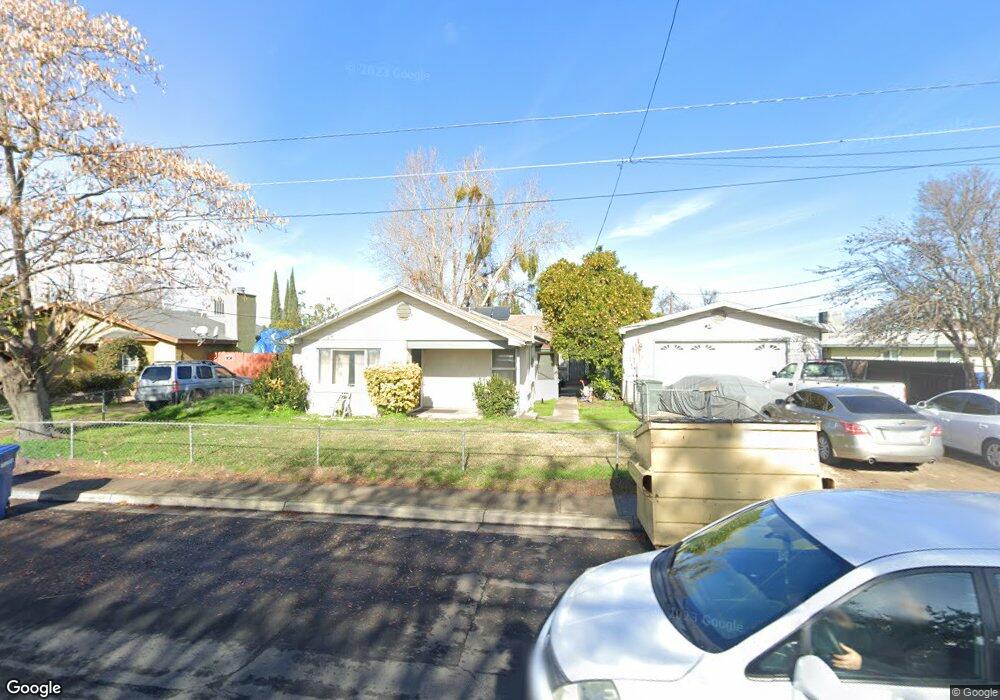
This home is located at 2617 Roeding Rd, Ceres, CA 95307 and is currently estimated at $495,933, approximately $190 per square foot. 2617 Roeding Rd is a home located in Stanislaus County with nearby schools including Cesar Chavez Junior High School, Central Valley High School, and Whitmore Charter High School.
Ownership History
Date
Name
Owned For
Owner Type
Purchase Details
Closed on
Sep 20, 2023
Sold by
Johnson Melvin and Johnson Katherine
Bought by
Turlock Irrigation District
Current Estimated Value
Purchase Details
Closed on
Sep 16, 2022
Sold by
Melvin Johnson
Bought by
Turlock Irrigation District
Purchase Details
Closed on
Oct 12, 2021
Sold by
Johnson Melvin and Johnson Katherine
Bought by
Turlock Irrigation District
Purchase Details
Closed on
Sep 10, 2013
Sold by
Johnson Melvin and Johnson Katherine
Bought by
Turlock Irrigation District
Purchase Details
Closed on
Aug 1, 1994
Sold by
Federal National Mortgage Association
Bought by
Johnson Melvin and Johnson Katherine
Home Financials for this Owner
Home Financials are based on the most recent Mortgage that was taken out on this home.
Original Mortgage
$120,250
Interest Rate
8.65%
Purchase Details
Closed on
Jun 1, 1994
Sold by
Armot Corp
Bought by
Federal National Mortgage Association
Create a Home Valuation Report for This Property
The Home Valuation Report is an in-depth analysis detailing your home's value as well as a comparison with similar homes in the area
Purchase History
| Date | Buyer | Sale Price | Title Company |
|---|---|---|---|
| Turlock Irrigation District | -- | -- | |
| Turlock Irrigation District | -- | -- | |
| Turlock Irrigation District | -- | -- | |
| Turlock Irrigation District | -- | None Available | |
| Johnson Melvin | $124,000 | North American Title Company | |
| Federal National Mortgage Association | $135,516 | First American Title Co |
Source: Public Records
Mortgage History
| Date | Status | Borrower | Loan Amount |
|---|---|---|---|
| Previous Owner | Johnson Melvin | $120,250 |
Source: Public Records
Tax History
| Year | Tax Paid | Tax Assessment Tax Assessment Total Assessment is a certain percentage of the fair market value that is determined by local assessors to be the total taxable value of land and additions on the property. | Land | Improvement |
|---|---|---|---|---|
| 2025 | $2,358 | $208,267 | $50,382 | $157,885 |
| 2024 | $2,209 | $204,185 | $49,395 | $154,790 |
| 2023 | $2,148 | $200,182 | $48,427 | $151,755 |
| 2022 | $2,128 | $196,258 | $47,478 | $148,780 |
| 2021 | $2,107 | $192,411 | $46,548 | $145,863 |
| 2020 | $2,042 | $190,439 | $46,071 | $144,368 |
| 2019 | $2,027 | $186,706 | $45,168 | $141,538 |
| 2018 | $1,984 | $183,046 | $44,283 | $138,763 |
| 2017 | $1,967 | $179,458 | $43,415 | $136,043 |
| 2016 | $1,925 | $175,940 | $42,564 | $133,376 |
| 2015 | $1,899 | $173,298 | $41,925 | $131,373 |
| 2014 | $1,859 | $169,904 | $41,104 | $128,800 |
Source: Public Records
Map
Nearby Homes
- 2708 Oasis Ave
- 3632 9th St
- 2812 Roswell Way
- 2921 5th St
- 3010 Roeding Rd
- 3550 Mitchell Rd Unit 59
- 3524 Homestead Way Unit 57
- 3939 Central Ave Unit 126
- 3939 Central Ave Unit 35
- 3939 Central Ave Unit 178
- 2728 Garrison St
- 3408 Puma Way
- 3009 Glen Grove Ct
- 3005 Willetts Way
- 3432 Vera Way
- 1628 Sungate Dr
- 2841 Fowler Rd Unit 89
- 2841 Fowler Rd Unit 33
- 2841 Fowler Rd Unit 42
- 3816 Dano Ct
Your Personal Tour Guide
Ask me questions while you tour the home.