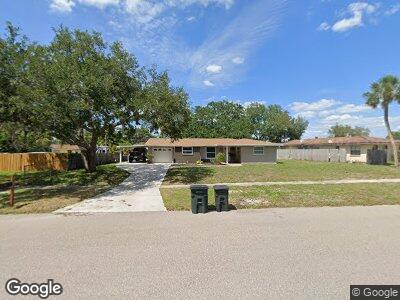
2619 Arnold St Sarasota, FL 34231
Ridge Wood Heights NeighborhoodEstimated Value: $332,000 - $372,000
2
Beds
2
Baths
1,329
Sq Ft
$261/Sq Ft
Est. Value
About This Home
This home is located at 2619 Arnold St, Sarasota, FL 34231 and is currently estimated at $346,297, approximately $260 per square foot. 2619 Arnold St is a home located in Sarasota County with nearby schools including Riverview High School, Phillippi Shores Elementary School, and Brookside Middle School.
Ownership History
Date
Name
Owned For
Owner Type
Purchase Details
Closed on
Aug 23, 2024
Sold by
Patel Naimish N
Bought by
Ilford D Llc
Current Estimated Value
Purchase Details
Closed on
Aug 28, 2013
Sold by
Blkswn Partners Llc
Bought by
Patel Naimish N
Purchase Details
Closed on
Jun 17, 2012
Sold by
Patel Naimish N
Bought by
Blkswn Partners Llc
Purchase Details
Closed on
Oct 26, 2011
Sold by
Hunter Dara M
Bought by
Patel Naimish N
Home Financials for this Owner
Home Financials are based on the most recent Mortgage that was taken out on this home.
Original Mortgage
$82,800
Interest Rate
4.16%
Mortgage Type
New Conventional
Purchase Details
Closed on
Mar 21, 1996
Sold by
Hunter Charles J
Bought by
Yoder Frank C and Yoder Mary Ellen
Create a Home Valuation Report for This Property
The Home Valuation Report is an in-depth analysis detailing your home's value as well as a comparison with similar homes in the area
Home Values in the Area
Average Home Value in this Area
Purchase History
| Date | Buyer | Sale Price | Title Company |
|---|---|---|---|
| Ilford D Llc | $100 | None Listed On Document | |
| Patel Naimish N | -- | Attorney | |
| Blkswn Partners Llc | -- | Attorney | |
| Patel Naimish N | $103,500 | Attorney | |
| Yoder Frank C | $190,000 | -- |
Source: Public Records
Mortgage History
| Date | Status | Borrower | Loan Amount |
|---|---|---|---|
| Previous Owner | Patel Naimish N | $82,800 | |
| Previous Owner | Hunter Charles F | $32,500 | |
| Previous Owner | Hunter Charles F | $116,000 | |
| Previous Owner | Hunter Charles F | $54,800 |
Source: Public Records
Tax History Compared to Growth
Tax History
| Year | Tax Paid | Tax Assessment Tax Assessment Total Assessment is a certain percentage of the fair market value that is determined by local assessors to be the total taxable value of land and additions on the property. | Land | Improvement |
|---|---|---|---|---|
| 2024 | $3,696 | $271,444 | -- | -- |
| 2023 | $3,696 | $270,300 | $133,100 | $137,200 |
| 2022 | $3,527 | $265,100 | $125,000 | $140,100 |
| 2021 | $3,121 | $204,300 | $88,900 | $115,400 |
| 2020 | $2,927 | $185,400 | $76,100 | $109,300 |
| 2019 | $2,829 | $188,100 | $78,500 | $109,600 |
| 2018 | $2,611 | $177,500 | $79,600 | $97,900 |
| 2017 | $2,510 | $135,762 | $0 | $0 |
| 2016 | $2,280 | $138,300 | $40,900 | $97,400 |
| 2015 | $2,144 | $122,600 | $34,400 | $88,200 |
| 2014 | $1,935 | $91,740 | $0 | $0 |
Source: Public Records
Map
Nearby Homes
- 3934 Brookside Dr
- 3637 Mineola Dr
- 3930 Elysian Woods Ln
- 2732 Arnold St
- 2723 Orchid Oaks Dr Unit 104
- 2458 Whippoorwill Cir
- 4045 Lisbon Place
- 4112 Swift Rd
- 2428 Whippoorwill Cir
- 2630 Moss Oak Dr Unit 50
- 2753 Orchid Oaks Dr Unit 104
- 2427 Tulip St
- 2825 Pinecrest St
- 4062 S Shade Ave
- 2566 Tulip St
- 2950 Forest Ln
- 3466 Tanglewood Dr
- 3376 S Seclusion Dr
- 4030 Worcester Rd
- 2826 Marlette St
- 2619 Arnold St
- 2623 Arnold St
- 2610 Bee Ridge Rd
- 2631 Arnold St
- 2620 Arnold St
- 2612 Arnold St
- 2608 Arnold St
- 2636 Bee Ridge Rd
- 2630 Arnold St
- 3920 Brookside Dr
- 3912 Brookside Dr
- 2639 Arnold St
- 3959 Brookside Dr
- 3938 Booth Place
- 3928 Brookside Dr
- 3955 Booth Place
- 2640 Arnold St
- 2642 Bee Ridge Rd
- 4001 Brookside Dr
- 3914 Briggs Ave