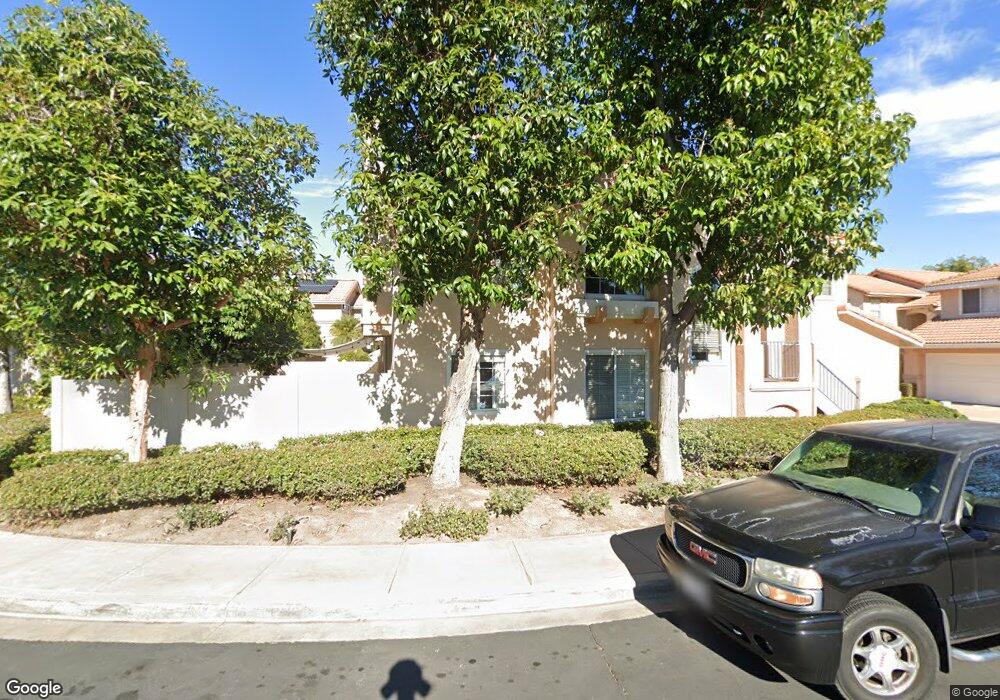
262 Brookview Ct Unit 29 Santee, CA 92071
Carlton Hills NeighborhoodEstimated Value: $688,000 - $770,000
3
Beds
2
Baths
1,369
Sq Ft
$527/Sq Ft
Est. Value
About This Home
This home is located at 262 Brookview Ct Unit 29, Santee, CA 92071 and is currently estimated at $720,965, approximately $526 per square foot. 262 Brookview Ct Unit 29 is a home located in San Diego County with nearby schools including Carlton Hills Elementary School and West Hills High School.
Ownership History
Date
Name
Owned For
Owner Type
Purchase Details
Closed on
Mar 23, 2018
Sold by
Gersztyn Joseph and Gersztyn Patricia
Bought by
Daniels Kelly and Daniels Dante
Current Estimated Value
Home Financials for this Owner
Home Financials are based on the most recent Mortgage that was taken out on this home.
Original Mortgage
$387,200
Outstanding Balance
$332,191
Interest Rate
4.43%
Mortgage Type
New Conventional
Estimated Equity
$388,774
Purchase Details
Closed on
Mar 10, 2011
Sold by
Gersztyn Joseph and Gersztyn Patricia
Bought by
Gersztyn Joseph and Gersztyn Patricia
Purchase Details
Closed on
Dec 31, 1996
Sold by
Kaufman & Broad Of San Diego Inc
Bought by
Gersztyn Joseph and Gersztyn Patricia
Home Financials for this Owner
Home Financials are based on the most recent Mortgage that was taken out on this home.
Original Mortgage
$62,000
Interest Rate
7.34%
Mortgage Type
Purchase Money Mortgage
Create a Home Valuation Report for This Property
The Home Valuation Report is an in-depth analysis detailing your home's value as well as a comparison with similar homes in the area
Home Values in the Area
Average Home Value in this Area
Purchase History
| Date | Buyer | Sale Price | Title Company |
|---|---|---|---|
| Daniels Kelly | $484,000 | Ticor Title San Diego Branch | |
| Gersztyn Joseph | -- | None Available | |
| Gersztyn Joseph | $160,500 | First American Title |
Source: Public Records
Mortgage History
| Date | Status | Borrower | Loan Amount |
|---|---|---|---|
| Open | Daniels Kelly | $387,200 | |
| Previous Owner | Gersztyn Joseph | $62,000 |
Source: Public Records
Tax History
| Year | Tax Paid | Tax Assessment Tax Assessment Total Assessment is a certain percentage of the fair market value that is determined by local assessors to be the total taxable value of land and additions on the property. | Land | Improvement |
|---|---|---|---|---|
| 2025 | $6,825 | $550,703 | $116,043 | $434,660 |
| 2024 | $6,825 | $539,906 | $113,768 | $426,138 |
| 2023 | $6,626 | $529,321 | $111,538 | $417,783 |
| 2022 | $6,582 | $518,943 | $109,351 | $409,592 |
| 2021 | $6,496 | $508,768 | $107,207 | $401,561 |
| 2020 | $6,419 | $503,552 | $106,108 | $397,444 |
| 2019 | $6,204 | $493,679 | $104,028 | $389,651 |
| 2018 | $1,300 | $81,776 | $17,232 | $64,544 |
| 2017 | $1,285 | $80,174 | $16,895 | $63,279 |
| 2016 | $1,254 | $78,603 | $16,564 | $62,039 |
| 2015 | $1,241 | $77,424 | $16,316 | $61,108 |
| 2014 | $1,222 | $75,908 | $15,997 | $59,911 |
Source: Public Records
Map
Nearby Homes
- 0 River Park Dr Unit na
- 405 Whispering Willow Dr Unit E
- 305 Cricket Ct
- 344 Waterbury Ct
- 9409 Pike Rd
- 9410 Pike Rd
- 9789 Lutheran Way
- 9857 Mission Gorge Rd Unit 4
- 9459 Mission Gorge Rd Unit 68
- 9459 Mission Gorge Rd Unit 121
- 9459 Mission Gorge Rd Unit 81
- 9842 Mission Greens Ct Unit 4
- 8825 Tamberly Way Unit A
- 9855 Mission Greens Ct Unit 4
- 9860 Buena Vista Ave Unit 3
- 9656 Domer Rd
- 9220 Mast Blvd Unit 27
- 9209 Arnaz Way
- 9428 Prospect Ave
- 9942 Theresa Ln
- 303 Brookview Ct
- 246 Brookview Ct
- 209 Brookview Ct
- 242 Brookview Ct
- 253 Brookview Ct Unit 16
- 241 Brookview Ct Unit 54
- 221 Brookview Ct
- 291 Brookview Ct
- 286 Brookview Ct
- 311 Brookview Ct Unit 1
- 261 Brookview Ct
- 265 Brookview Ct
- 269 Brookview Ct Unit 12
- 271 Brookview Ct
- 275 Brookview Ct
- 287 Brookview Ct
- 295 Brookview Ct
- 307 Brookview Ct Unit 2
- 257 Brookview Ct
- 210 Brookview Ct
Your Personal Tour Guide
Ask me questions while you tour the home.