26211 Devonshire Mission Viejo, CA 92692
Estimated Value: $1,066,000 - $1,153,717
3
Beds
3
Baths
1,745
Sq Ft
$634/Sq Ft
Est. Value
About This Home
This home is located at 26211 Devonshire, Mission Viejo, CA 92692 and is currently estimated at $1,106,929, approximately $634 per square foot. 26211 Devonshire is a home located in Orange County with nearby schools including Bathgate Elementary School, Newhart Middle School, and Capistrano Valley High School.
Ownership History
Date
Name
Owned For
Owner Type
Purchase Details
Closed on
Aug 29, 2023
Sold by
Astor Elizabeth
Bought by
Elizabeth Astor Trust and Astor
Current Estimated Value
Purchase Details
Closed on
May 27, 2005
Sold by
Weber Jean Marc
Bought by
Astor Elizabeth
Home Financials for this Owner
Home Financials are based on the most recent Mortgage that was taken out on this home.
Original Mortgage
$476,250
Interest Rate
5.25%
Mortgage Type
Purchase Money Mortgage
Purchase Details
Closed on
Jun 21, 1999
Sold by
Le Galley David J and Le Sharon Galley
Bought by
Weber Jean Marc
Home Financials for this Owner
Home Financials are based on the most recent Mortgage that was taken out on this home.
Original Mortgage
$187,000
Interest Rate
7.64%
Create a Home Valuation Report for This Property
The Home Valuation Report is an in-depth analysis detailing your home's value as well as a comparison with similar homes in the area
Home Values in the Area
Average Home Value in this Area
Purchase History
| Date | Buyer | Sale Price | Title Company |
|---|---|---|---|
| Elizabeth Astor Trust | -- | None Listed On Document | |
| Astor Elizabeth | $635,000 | California Title Company | |
| Weber Jean Marc | $262,000 | Lawyers Title Company |
Source: Public Records
Mortgage History
| Date | Status | Borrower | Loan Amount |
|---|---|---|---|
| Previous Owner | Astor Elizabeth | $476,250 | |
| Previous Owner | Weber Jean Marc | $187,000 |
Source: Public Records
Tax History Compared to Growth
Tax History
| Year | Tax Paid | Tax Assessment Tax Assessment Total Assessment is a certain percentage of the fair market value that is determined by local assessors to be the total taxable value of land and additions on the property. | Land | Improvement |
|---|---|---|---|---|
| 2025 | $8,689 | $885,130 | $636,516 | $248,614 |
| 2024 | $8,689 | $867,775 | $624,035 | $243,740 |
| 2023 | $6,851 | $687,704 | $491,697 | $196,007 |
| 2022 | $6,716 | $674,220 | $482,056 | $192,164 |
| 2021 | $6,583 | $661,000 | $472,603 | $188,397 |
| 2020 | $6,583 | $661,000 | $472,603 | $188,397 |
| 2019 | $6,583 | $661,000 | $472,603 | $188,397 |
| 2018 | $6,582 | $661,000 | $472,603 | $188,397 |
| 2017 | $5,990 | $602,000 | $413,603 | $188,397 |
| 2016 | $5,318 | $535,036 | $346,639 | $188,397 |
| 2015 | $5,551 | $527,000 | $341,432 | $185,568 |
| 2014 | $5,123 | $484,387 | $298,819 | $185,568 |
Source: Public Records
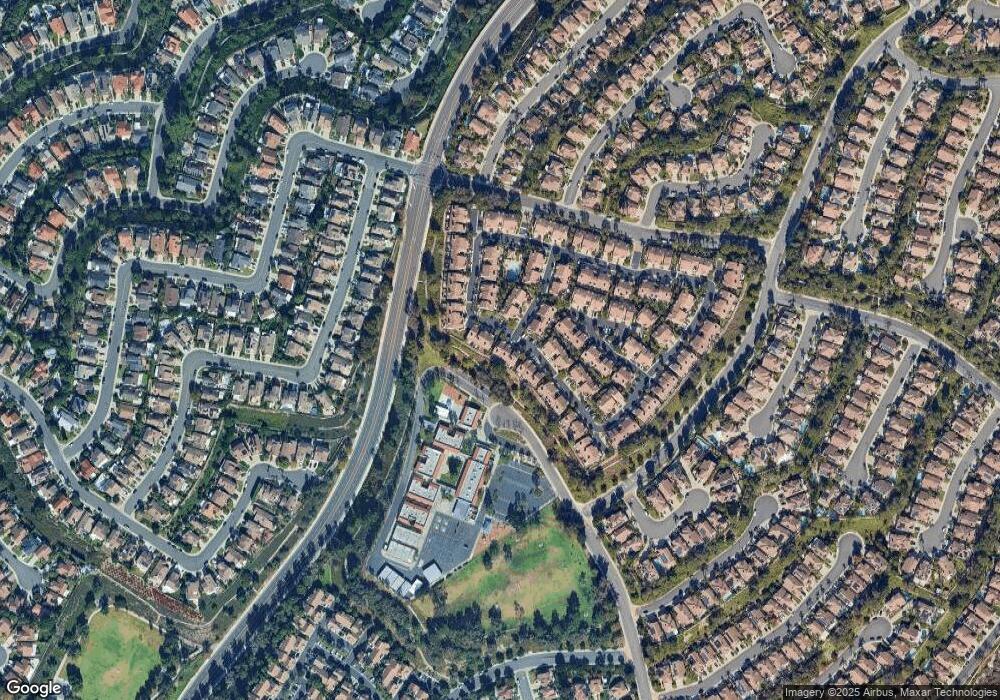
Map
Nearby Homes
- 27721 Rubidoux
- 26192 Golada
- 26032 Ravenna Rd
- 26035 Ravenna Rd
- 27533 Calinda
- 26466 San Torini Rd
- 16 Cambria Unit 32
- 4 Le Mans
- 27402 Carino Cir
- 139 Melrose Dr
- 26732 Trasmiras
- 26848 Park Terrace Ln Unit 130
- 26896 Park Terrace Ln Unit 229
- 35 Rimani Dr
- 26611 Loma Verde
- 26381 Amapola Ln
- 25911 Orbita Unit 88
- 26835 Poveda Unit 29
- 25835 Marguerite Pkwy Unit 8201
- 25805 Marguerite Pkwy Unit B102
- 26215 Devonshire
- 26207 Devonshire
- 26219 Devonshire
- 26203 Devonshire
- 26199 Devonshire
- 26223 Devonshire
- 26187 Marquette
- 26227 Devonshire
- 26188 Marquette
- 26183 Marquette
- 26184 Palomares
- 26231 Devonshire
- 26184 Marquette
- 26224 Devonshire
- 26195 Palomares
- 26179 Marquette
- 26180 Palomares
- 26228 Devonshire
- 26180 Marquette
- 26191 Palomares