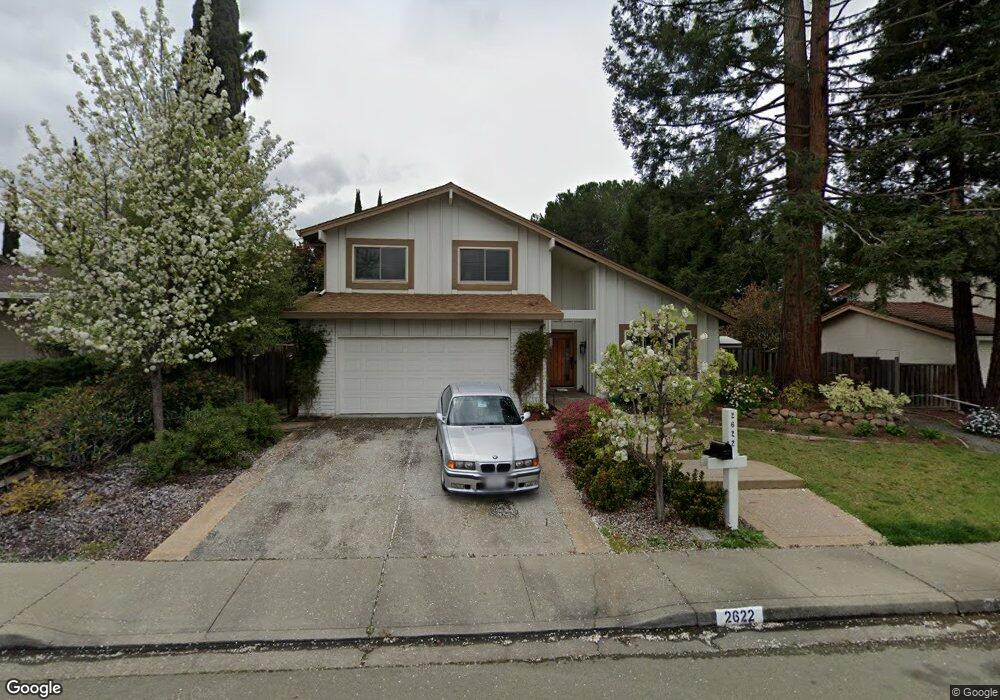
2622 Marsh Dr San Ramon, CA 94583
Twin Creeks NeighborhoodEstimated Value: $1,527,000 - $1,633,000
4
Beds
3
Baths
2,029
Sq Ft
$771/Sq Ft
Est. Value
About This Home
This home is located at 2622 Marsh Dr, San Ramon, CA 94583 and is currently estimated at $1,563,777, approximately $770 per square foot. 2622 Marsh Dr is a home located in Contra Costa County with nearby schools including Twin Creeks Elementary School, Iron Horse Middle School, and California High School.
Ownership History
Date
Name
Owned For
Owner Type
Purchase Details
Closed on
Sep 11, 2019
Sold by
Bauernfeind William J
Bought by
Bauernfeind Celia and Bauernfeind William
Current Estimated Value
Purchase Details
Closed on
Sep 28, 2018
Sold by
Bauernfeind William and Bauernfeind Celia G
Bought by
Bauernfeind Celia G
Purchase Details
Closed on
Dec 19, 2005
Sold by
The Patricia E Bauernfeind & William J B
Bought by
Bauernfeind William J
Home Financials for this Owner
Home Financials are based on the most recent Mortgage that was taken out on this home.
Original Mortgage
$664,000
Outstanding Balance
$367,751
Interest Rate
6.12%
Mortgage Type
Stand Alone Refi Refinance Of Original Loan
Estimated Equity
$1,196,026
Purchase Details
Closed on
Mar 27, 2003
Sold by
Bauernfeind Patricia E and Bauernfeind William J
Bought by
Bauernfeind Patricia E and Bauernfeind William J
Purchase Details
Closed on
Jun 30, 2000
Sold by
Patterson and Earnestine
Bought by
Bauernfeind William J and Bauernfeind Patricia E
Home Financials for this Owner
Home Financials are based on the most recent Mortgage that was taken out on this home.
Original Mortgage
$375,950
Interest Rate
7.37%
Mortgage Type
Purchase Money Mortgage
Create a Home Valuation Report for This Property
The Home Valuation Report is an in-depth analysis detailing your home's value as well as a comparison with similar homes in the area
Home Values in the Area
Average Home Value in this Area
Purchase History
| Date | Buyer | Sale Price | Title Company |
|---|---|---|---|
| Bauernfeind Celia | -- | None Available | |
| Bauernfeind Celia G | -- | Old Republic Title Company | |
| Bauernfeind William J | -- | Placer Title | |
| Bauernfeind Patricia E | -- | -- | |
| Bauernfeind William J | $470,000 | Commonwealth Land Title Co |
Source: Public Records
Mortgage History
| Date | Status | Borrower | Loan Amount |
|---|---|---|---|
| Open | Bauernfeind William J | $664,000 | |
| Closed | Bauernfeind William J | $375,950 | |
| Closed | Bauernfeind William J | $46,995 |
Source: Public Records
Tax History
| Year | Tax Paid | Tax Assessment Tax Assessment Total Assessment is a certain percentage of the fair market value that is determined by local assessors to be the total taxable value of land and additions on the property. | Land | Improvement |
|---|---|---|---|---|
| 2025 | $8,696 | $711,170 | $361,630 | $349,540 |
| 2024 | $8,369 | $697,227 | $354,540 | $342,687 |
| 2023 | $8,369 | $683,557 | $347,589 | $335,968 |
| 2022 | $8,305 | $670,155 | $340,774 | $329,381 |
| 2021 | $8,121 | $657,016 | $334,093 | $322,923 |
| 2019 | $7,934 | $637,531 | $324,185 | $313,346 |
| 2018 | $7,638 | $625,031 | $317,829 | $307,202 |
| 2017 | $9,872 | $612,777 | $311,598 | $301,179 |
| 2016 | $7,254 | $600,763 | $305,489 | $295,274 |
| 2015 | $7,153 | $591,740 | $300,901 | $290,839 |
| 2014 | $7,047 | $580,149 | $295,007 | $285,142 |
Source: Public Records
Map
Nearby Homes
- 2612 Durango Ln
- 109 Posada Ct
- 446 Santander Dr
- 560 La Copita Ct
- 2482 Wildhorse Dr
- 34 Pony Ct
- 200 Compton Cir Unit C
- 2785 Canyon Creek Dr
- 2782 Canyon Creek Dr
- 2749 Fountainhead Dr
- 207 Bisque Ct
- 521 Lapis Ct
- 325 Isabelline Ct
- 5005 Seashell Terrace
- 326 Isabelline Ct
- 7007 Sunglow Terrace
- 3108 Seashell Terrace
- 6008 Sunglow Terrace
- 3112 Seashell Terrace
- 219 Forest Creek Ln
Your Personal Tour Guide
Ask me questions while you tour the home.