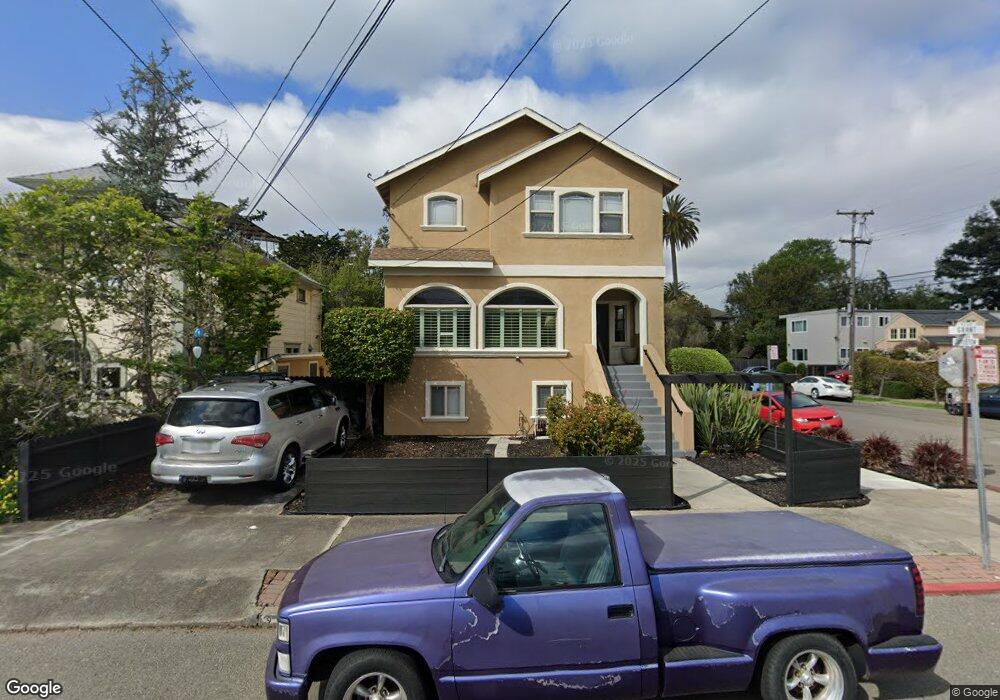
2628 Grant St Berkeley, CA 94703
South Berkeley NeighborhoodEstimated Value: $1,226,000 - $1,798,000
6
Beds
4
Baths
1,688
Sq Ft
$945/Sq Ft
Est. Value
About This Home
This home is located at 2628 Grant St, Berkeley, CA 94703 and is currently estimated at $1,595,226, approximately $945 per square foot. 2628 Grant St is a home located in Alameda County with nearby schools including Malcolm X Elementary School, Emerson Elementary School, and John Muir Elementary School.
Ownership History
Date
Name
Owned For
Owner Type
Purchase Details
Closed on
Aug 29, 2006
Sold by
Simmons Rhonda R and Rhonda R Simmons Real Property
Bought by
Simmons Rhonda R
Current Estimated Value
Home Financials for this Owner
Home Financials are based on the most recent Mortgage that was taken out on this home.
Original Mortgage
$523,000
Outstanding Balance
$327,206
Interest Rate
7.45%
Mortgage Type
Purchase Money Mortgage
Estimated Equity
$1,268,020
Purchase Details
Closed on
Dec 9, 2002
Sold by
Simmons Rhonda R
Bought by
Simmons Rhonda R and The Rhonda R Simmons Real Prop
Purchase Details
Closed on
Sep 18, 2001
Sold by
Safford Central and Carr Joan
Bought by
Simmons Rhonda R
Home Financials for this Owner
Home Financials are based on the most recent Mortgage that was taken out on this home.
Original Mortgage
$216,000
Interest Rate
6.9%
Create a Home Valuation Report for This Property
The Home Valuation Report is an in-depth analysis detailing your home's value as well as a comparison with similar homes in the area
Home Values in the Area
Average Home Value in this Area
Purchase History
| Date | Buyer | Sale Price | Title Company |
|---|---|---|---|
| Simmons Rhonda R | -- | First American Title Co | |
| Simmons Rhonda R | -- | -- | |
| Simmons Rhonda R | $240,000 | First American Title Guarant |
Source: Public Records
Mortgage History
| Date | Status | Borrower | Loan Amount |
|---|---|---|---|
| Open | Simmons Rhonda R | $523,000 | |
| Closed | Simmons Rhonda R | $216,000 |
Source: Public Records
Tax History Compared to Growth
Tax History
| Year | Tax Paid | Tax Assessment Tax Assessment Total Assessment is a certain percentage of the fair market value that is determined by local assessors to be the total taxable value of land and additions on the property. | Land | Improvement |
|---|---|---|---|---|
| 2025 | $10,982 | $518,503 | $147,720 | $370,783 |
| 2024 | $10,982 | $508,338 | $144,824 | $363,514 |
| 2023 | $10,724 | $498,373 | $141,985 | $356,388 |
| 2022 | $10,459 | $488,601 | $139,201 | $349,400 |
| 2021 | $10,439 | $479,023 | $136,472 | $342,551 |
| 2020 | $9,674 | $474,112 | $135,073 | $339,039 |
| 2019 | $9,076 | $464,818 | $132,425 | $332,393 |
| 2018 | $8,881 | $455,707 | $129,829 | $325,878 |
| 2017 | $8,560 | $446,774 | $127,284 | $319,490 |
| 2016 | $8,143 | $438,016 | $124,789 | $313,227 |
| 2015 | $8,014 | $431,439 | $122,915 | $308,524 |
| 2014 | $7,904 | $422,990 | $120,508 | $302,482 |
Source: Public Records
Map
Nearby Homes
- 1726 Parker St Unit 2
- 1726 Parker St Unit 1
- 1819 Carleton St
- 1711 Carleton St
- 2701 Grant St
- 2533 Grant St
- 1901 Parker St Unit 3
- 1612 Parker St
- 1606 Derby St
- 1524 Blake St
- 1516 Blake St
- 1516 Blake St Unit A
- 1540 Stuart St
- 2829 California St
- 2750 Sacramento St
- 2926 Ellis St
- 1450 Ward St
- 2758 Sacramento St
- 2774 Sacramento St
- 2782 Sacramento St