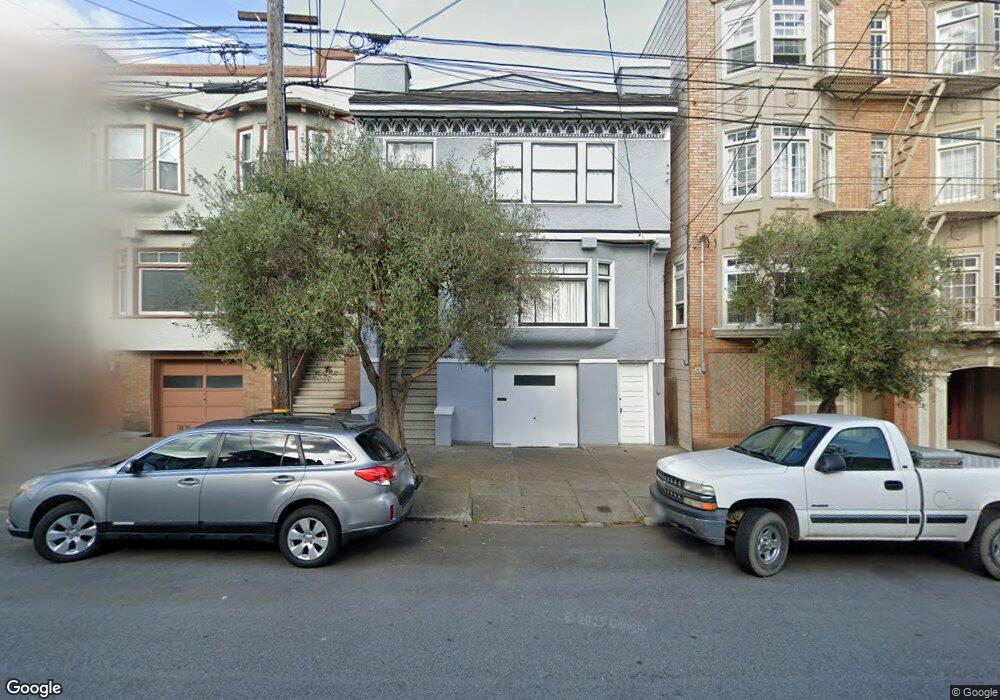
263 9th Ave San Francisco, CA 94118
Inner Richmond NeighborhoodEstimated Value: $2,538,000 - $3,328,000
Studio
3
Baths
2,483
Sq Ft
$1,169/Sq Ft
Est. Value
About This Home
This home is located at 263 9th Ave, San Francisco, CA 94118 and is currently estimated at $2,902,915, approximately $1,169 per square foot. 263 9th Ave is a home located in San Francisco County with nearby schools including Sutro Elementary School, Roosevelt Middle School, and Creative Arts Charter School.
Ownership History
Date
Name
Owned For
Owner Type
Purchase Details
Closed on
Oct 7, 2022
Sold by
Prince Carol Kathleen
Bought by
Prince Vindum Revocable Trust
Current Estimated Value
Purchase Details
Closed on
Feb 15, 2022
Sold by
Carol Kathleen Prince Revocable Trust
Bought by
Prince Carol Kathleen and Vindum Jens Verner
Purchase Details
Closed on
Oct 9, 2012
Sold by
Prince Carol K
Bought by
Prince Carol Kathleen
Create a Home Valuation Report for This Property
The Home Valuation Report is an in-depth analysis detailing your home's value as well as a comparison with similar homes in the area
Home Values in the Area
Average Home Value in this Area
Purchase History
| Date | Buyer | Sale Price | Title Company |
|---|---|---|---|
| Prince Vindum Revocable Trust | -- | -- | |
| Prince Carol Kathleen | -- | None Listed On Document | |
| Prince Carol Kathleen | -- | None Available |
Source: Public Records
Tax History
| Year | Tax Paid | Tax Assessment Tax Assessment Total Assessment is a certain percentage of the fair market value that is determined by local assessors to be the total taxable value of land and additions on the property. | Land | Improvement |
|---|---|---|---|---|
| 2025 | $2,210 | $189,876 | $45,498 | $144,378 |
| 2024 | $2,210 | $186,154 | $44,606 | $141,548 |
| 2023 | $2,178 | $182,505 | $43,732 | $138,773 |
| 2022 | $2,139 | $178,927 | $42,875 | $136,052 |
| 2021 | $2,103 | $175,420 | $42,035 | $133,385 |
| 2020 | $2,108 | $173,622 | $41,604 | $132,018 |
| 2019 | $2,037 | $170,219 | $40,789 | $129,430 |
| 2018 | $1,970 | $166,883 | $39,990 | $126,893 |
| 2017 | $1,947 | $163,611 | $39,206 | $124,405 |
| 2016 | $1,888 | $160,404 | $38,438 | $121,966 |
| 2015 | $1,865 | $157,995 | $37,861 | $120,134 |
| 2014 | $1,816 | $154,901 | $37,120 | $117,781 |
Source: Public Records
Map
Nearby Homes
- 326 11th Ave
- 263-265 8th Ave
- 4829 California St
- 373 6th Ave
- 458 11th Ave Unit 458
- 456 11th Ave Unit 456
- 456 11th Ave
- 169 11th Ave Unit 169
- 167-169 11th Ave
- 167 11th Ave Unit 169
- 255 5th Ave
- 421 Cornwall St
- 333 14th Ave
- 258-260 5th Ave
- 4135 California St Unit 7
- 4135 California St Unit 1
- 558-560 Balboa St
- 1124 Balboa St
- 1533 Clement St
- 607 6th Ave
Your Personal Tour Guide
Ask me questions while you tour the home.