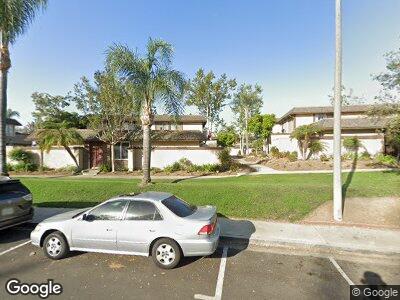
26312 Via Roble Mission Viejo, CA 92691
Estimated Value: $608,000 - $638,000
3
Beds
2
Baths
1,120
Sq Ft
$559/Sq Ft
Est. Value
About This Home
This home is located at 26312 Via Roble, Mission Viejo, CA 92691 and is currently estimated at $626,240, approximately $559 per square foot. 26312 Via Roble is a home located in Orange County with nearby schools including Glen Yermo Elementary School, Los Alisos Intermediate School, and Mission Viejo High School.
Ownership History
Date
Name
Owned For
Owner Type
Purchase Details
Closed on
Oct 19, 2020
Sold by
Boles Sharon Marie
Bought by
Boles Sharon Marie and Sharon Marie Boles Living Trus
Current Estimated Value
Home Financials for this Owner
Home Financials are based on the most recent Mortgage that was taken out on this home.
Original Mortgage
$222,600
Outstanding Balance
$201,220
Interest Rate
2.8%
Mortgage Type
New Conventional
Estimated Equity
$436,236
Purchase Details
Closed on
Feb 15, 2020
Sold by
Boles Sharon
Bought by
Boles Sharon Marie and Sharon Marie Boles Living Trus
Purchase Details
Closed on
May 29, 2008
Sold by
Mcphee Barbara A
Bought by
Boles Sharon
Home Financials for this Owner
Home Financials are based on the most recent Mortgage that was taken out on this home.
Original Mortgage
$262,874
Interest Rate
6%
Mortgage Type
FHA
Create a Home Valuation Report for This Property
The Home Valuation Report is an in-depth analysis detailing your home's value as well as a comparison with similar homes in the area
Home Values in the Area
Average Home Value in this Area
Purchase History
| Date | Buyer | Sale Price | Title Company |
|---|---|---|---|
| Boles Sharon Marie | -- | Amrock Inc | |
| Boles Sharon Marie | -- | Amrock Llc | |
| Boles Sharon Marie | -- | None Available | |
| Boles Sharon | $267,000 | Landwood Title Company |
Source: Public Records
Mortgage History
| Date | Status | Borrower | Loan Amount |
|---|---|---|---|
| Open | Boles Sharon Marie | $222,600 | |
| Closed | Boles Sharon | $241,850 | |
| Closed | Boles Sharon | $264,889 | |
| Closed | Boles Sharon | $262,874 | |
| Previous Owner | Mcphee Barbara A | $59,000 | |
| Previous Owner | Mcphee Barbara A | $113,000 | |
| Previous Owner | Mcphee Barbara A | $112,000 |
Source: Public Records
Tax History Compared to Growth
Tax History
| Year | Tax Paid | Tax Assessment Tax Assessment Total Assessment is a certain percentage of the fair market value that is determined by local assessors to be the total taxable value of land and additions on the property. | Land | Improvement |
|---|---|---|---|---|
| 2024 | $3,482 | $337,081 | $248,389 | $88,692 |
| 2023 | $3,399 | $330,472 | $243,519 | $86,953 |
| 2022 | $3,339 | $323,993 | $238,744 | $85,249 |
| 2021 | $3,273 | $317,641 | $234,063 | $83,578 |
| 2020 | $3,244 | $314,384 | $231,662 | $82,722 |
| 2019 | $3,179 | $308,220 | $227,120 | $81,100 |
| 2018 | $3,120 | $302,177 | $222,667 | $79,510 |
| 2017 | $3,058 | $296,252 | $218,301 | $77,951 |
| 2016 | $3,007 | $290,444 | $214,021 | $76,423 |
| 2015 | $2,971 | $286,082 | $210,806 | $75,276 |
| 2014 | $2,547 | $245,575 | $175,318 | $70,257 |
Source: Public Records
Map
Nearby Homes
- 26258 Via Roble Unit 36
- 26284 Via Roble Unit 2
- 26428 Via Roble
- 26436 Via Roble Unit 35
- 26201 Via Roble Unit 1a
- 22792 La Quinta Dr
- 26148 Via Pera Unit 4
- 25957 Via Pera Unit C4
- 22671 Cheryl Way
- 26205 La Real Unit C
- 22602 Manalastas Dr
- 26065 Las Flores Unit C
- 23351 La Crescenta Unit B311
- 23391 La Crescenta Unit 270C
- 22492 Eloise Dr
- 22471 Rippling Brook
- 22612 Rockford Dr
- 26166 Los Viveros Unit 222
- 26492 Dineral
- 22421 Rippling Brook
- 26316 Via Roble Unit 15
- 26342 Via Roble Unit 21
- 26318 Via Roble Unit 16
- 26348 Via Roble Unit 24
- 26326 Via Roble Unit 27
- 26324 Via Roble Unit 26
- 26314 Via Roble Unit 14
- 26346 Via Roble Unit 23
- 26312 Via Roble
- 26338 Via Roble Unit 20
- 26318 Via Roble
- 26334 Via Roble Unit 18
- 26328 Via Roble
- 26344 Via Roble
- 26342 Via Roble
- 26316 Via Roble
- 26273 Via Roble Unit 6
- 26273 Via Roble
- 26276 Via Roble
- 26272 Via Roble