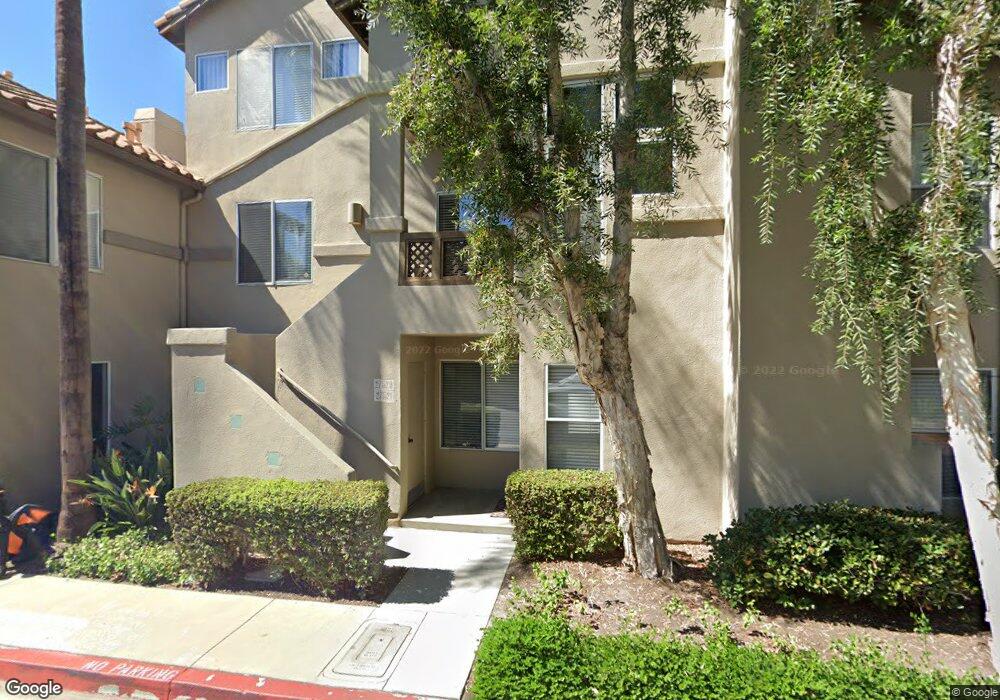
26409 Portola Unit 102 Mission Viejo, CA 92692
Estimated Value: $671,321 - $775,000
2
Beds
2
Baths
1,017
Sq Ft
$728/Sq Ft
Est. Value
About This Home
This home is located at 26409 Portola Unit 102, Mission Viejo, CA 92692 and is currently estimated at $740,330, approximately $727 per square foot. 26409 Portola Unit 102 is a home located in Orange County with nearby schools including Bathgate Elementary School, Newhart Middle School, and Capistrano Valley High School.
Ownership History
Date
Name
Owned For
Owner Type
Purchase Details
Closed on
Nov 26, 2012
Sold by
Mosebach Anita
Bought by
Downs Anita and 2003 Anita Mosebach Revocable Trust
Current Estimated Value
Home Financials for this Owner
Home Financials are based on the most recent Mortgage that was taken out on this home.
Original Mortgage
$119,500
Outstanding Balance
$82,638
Interest Rate
3.33%
Mortgage Type
New Conventional
Estimated Equity
$657,692
Purchase Details
Closed on
Jul 28, 2003
Sold by
Mosebach Anita
Bought by
Mosebach Anita and 2003 Anita Mosebach Revocable Trust
Purchase Details
Closed on
May 29, 1997
Sold by
Randall Luebberke Mark and Jean Luebberke Linda
Bought by
Mosebach Anita
Home Financials for this Owner
Home Financials are based on the most recent Mortgage that was taken out on this home.
Original Mortgage
$119,794
Interest Rate
7.91%
Mortgage Type
FHA
Create a Home Valuation Report for This Property
The Home Valuation Report is an in-depth analysis detailing your home's value as well as a comparison with similar homes in the area
Home Values in the Area
Average Home Value in this Area
Purchase History
| Date | Buyer | Sale Price | Title Company |
|---|---|---|---|
| Downs Anita | -- | Lawyers Title Company | |
| Mosebach Anita | -- | -- | |
| Mosebach Anita | $123,500 | Fidelity National Title Ins |
Source: Public Records
Mortgage History
| Date | Status | Borrower | Loan Amount |
|---|---|---|---|
| Open | Downs Anita | $119,500 | |
| Closed | Mosebach Anita | $119,794 |
Source: Public Records
Tax History Compared to Growth
Tax History
| Year | Tax Paid | Tax Assessment Tax Assessment Total Assessment is a certain percentage of the fair market value that is determined by local assessors to be the total taxable value of land and additions on the property. | Land | Improvement |
|---|---|---|---|---|
| 2025 | $2,002 | $201,132 | $60,689 | $140,443 |
| 2024 | $2,002 | $197,189 | $59,499 | $137,690 |
| 2023 | $1,956 | $193,323 | $58,332 | $134,991 |
| 2022 | $1,918 | $189,533 | $57,188 | $132,345 |
| 2021 | $1,880 | $185,817 | $56,067 | $129,750 |
| 2020 | $1,861 | $183,912 | $55,492 | $128,420 |
| 2019 | $1,825 | $180,306 | $54,404 | $125,902 |
| 2018 | $1,789 | $176,771 | $53,337 | $123,434 |
| 2017 | $1,754 | $173,305 | $52,291 | $121,014 |
| 2016 | $1,720 | $169,907 | $51,265 | $118,642 |
| 2015 | $1,950 | $167,355 | $50,495 | $116,860 |
| 2014 | $1,917 | $164,077 | $49,506 | $114,571 |
Source: Public Records
Map
Nearby Homes
- 27533 Calinda
- 26466 San Torini Rd
- 26192 Golada
- 26611 Strafford
- 27721 Rubidoux
- 26032 Ravenna Rd
- 26035 Ravenna Rd
- 26732 Trasmiras
- 26101 Calle Cresta
- 26848 Park Terrace Ln Unit 130
- 26896 Park Terrace Ln Unit 229
- 26611 Loma Verde
- 26998 El Retiro
- 16 Cambria Unit 32
- 27075 La Fuente
- 27402 Carino Cir
- 27090 S Ridge Dr
- 26823 Poveda Unit 23
- 26635 Guadiana
- 25911 Orbita Unit 88
- 26401 Portola
- 26403 Portola
- 26405 Portola Unit 97
- 26417 Portola
- 26407 Portola
- 26412 Vicente Lugo
- 27527 Calinda
- 27531 Calinda Unit 108
- 27529 Calinda
- 26411 Portola
- 27523 Calinda
- 27525 Calinda
- 27521 Calinda
- 26413 Portola
- 26415 Portola
- 26419 Portola
- 26427 Verdugo
- 26421 Portola
- 26425 Portola
- 26422 Vicente Lugo