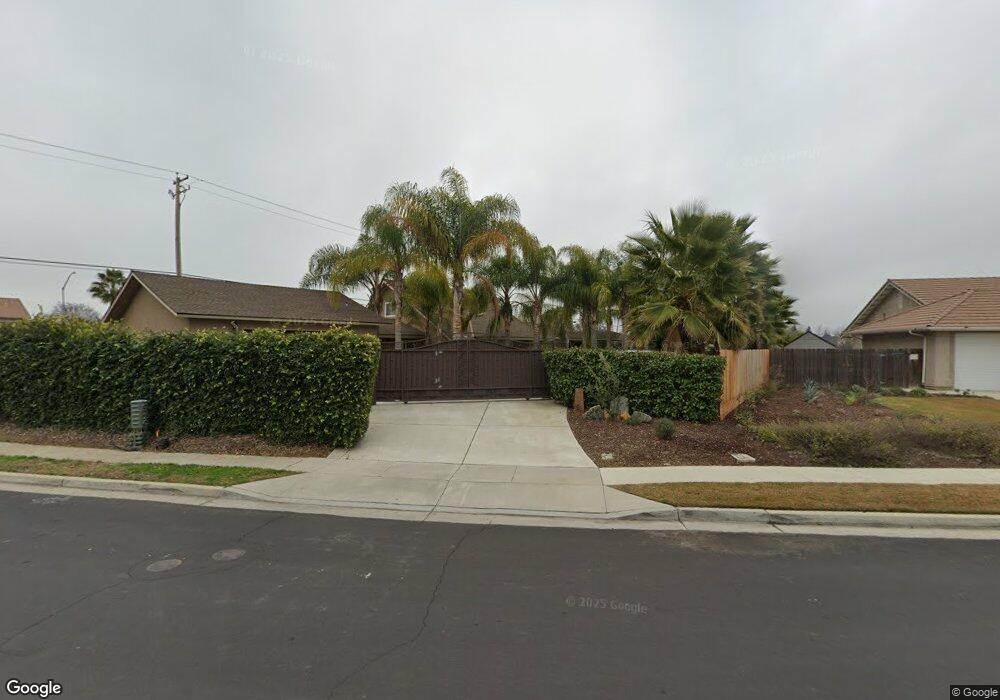
2641 Florence Ave Sanger, CA 93657
Estimated Value: $444,000 - $467,000
3
Beds
3
Baths
1,940
Sq Ft
$233/Sq Ft
Est. Value
About This Home
This home is located at 2641 Florence Ave, Sanger, CA 93657 and is currently estimated at $451,872, approximately $232 per square foot. 2641 Florence Ave is a home located in Fresno County with nearby schools including Reagan Elementary School, Washington Academic Middle School, and Sanger High School.
Ownership History
Date
Name
Owned For
Owner Type
Purchase Details
Closed on
Dec 1, 2023
Sold by
Perez Trinidad and Perez Maria G
Bought by
Perez Trinidad R
Current Estimated Value
Purchase Details
Closed on
Nov 28, 2023
Sold by
Perez Trinidad and Perez Maria G
Bought by
Perez Trinidad R
Purchase Details
Closed on
Apr 8, 2011
Sold by
Wells Fargo Bank Na
Bought by
Valencia Perez Trinidad and Valencia De Perez Maria G
Purchase Details
Closed on
Oct 19, 2010
Sold by
Hovannisian Ralph and Hovannisian Janet
Bought by
Wells Fargo Bank Na
Purchase Details
Closed on
Mar 1, 2010
Sold by
Hovannisian Ralph and Hovannisian Janet
Bought by
Sjvr Rental Properties Llc
Purchase Details
Closed on
Aug 9, 2007
Sold by
Mister C Investments Inc
Bought by
Hovannisian Ralph and Hovannisian Janet
Purchase Details
Closed on
May 2, 2007
Sold by
Sanger Ii Ca Llc
Bought by
Mister C Investment Inc
Create a Home Valuation Report for This Property
The Home Valuation Report is an in-depth analysis detailing your home's value as well as a comparison with similar homes in the area
Home Values in the Area
Average Home Value in this Area
Purchase History
| Date | Buyer | Sale Price | Title Company |
|---|---|---|---|
| Perez Trinidad R | -- | None Listed On Document | |
| Perez Trinidad R | -- | None Listed On Document | |
| Valencia Perez Trinidad | $65,000 | Placer Title Company | |
| Wells Fargo Bank Na | $112,421 | Accommodation | |
| Sjvr Rental Properties Llc | -- | None Available | |
| Hovannisian Ralph | $140,000 | Chicago Title Company | |
| Mister C Investment Inc | -- | Chicago Title Company |
Source: Public Records
Tax History
| Year | Tax Paid | Tax Assessment Tax Assessment Total Assessment is a certain percentage of the fair market value that is determined by local assessors to be the total taxable value of land and additions on the property. | Land | Improvement |
|---|---|---|---|---|
| 2025 | $1,244 | $89,632 | $25,617 | $64,015 |
| 2023 | $1,171 | $86,153 | $24,623 | $61,530 |
| 2022 | $1,081 | $78,465 | $24,141 | $54,324 |
| 2021 | $1,073 | $76,927 | $23,668 | $53,259 |
| 2020 | $1,045 | $76,139 | $23,426 | $52,713 |
| 2019 | $1,026 | $74,647 | $22,967 | $51,680 |
| 2018 | $988 | $73,184 | $22,517 | $50,667 |
| 2017 | $973 | $71,750 | $22,076 | $49,674 |
| 2016 | $921 | $70,344 | $21,644 | $48,700 |
| 2015 | $927 | $69,288 | $21,319 | $47,969 |
| 2014 | $916 | $67,932 | $20,902 | $47,030 |
Source: Public Records
Map
Nearby Homes
- 2563 Langport Ave Unit BH 33
- 53 Dalton Ave
- 2702 Holt Ave
- 45 Lyon Ave
- 285 Claremont Ave
- 238 Fairbanks Ave
- 372 Lily Ave
- 169 Rosewood Ave
- 2160 3rd St
- 371 Bethel Ave Unit 74
- 371 Bethel Ave Unit 59
- 371 Bethel Ave
- 371 Bethel Ave Unit 99
- 371 Bethel Ave Unit 24
- 371 Bethel Ave Unit 88
- 1745 N Bethel Ave
- 85 Acacia Dr
- 814 Brehler Ave
- 805 Lyon Ave
- 2986 Mary Ave
- 2655 Florence Ave
- 2658 Florence Ave
- 2671 Florence Ave
- 2670 Florence Ave
- 2620 Atchison Ave
- 2623 Atchison Ave
- 2626 Atchison Ave
- 2690 Florence Ave
- 20 N Lily Ave
- 2504 S Bethel Ave
- 15 Claremont Ave
- 23 N Wathen Ave
- 11 N Wathen Ave
- 2629 Atchison Ave
- 40 N Lily Ave
- 3 N Wathen Ave
- 2699 Florence Ave
- 57 N Wathen Ave
- 2632 Atchison Ave
- 26 Claremont Ave
Your Personal Tour Guide
Ask me questions while you tour the home.