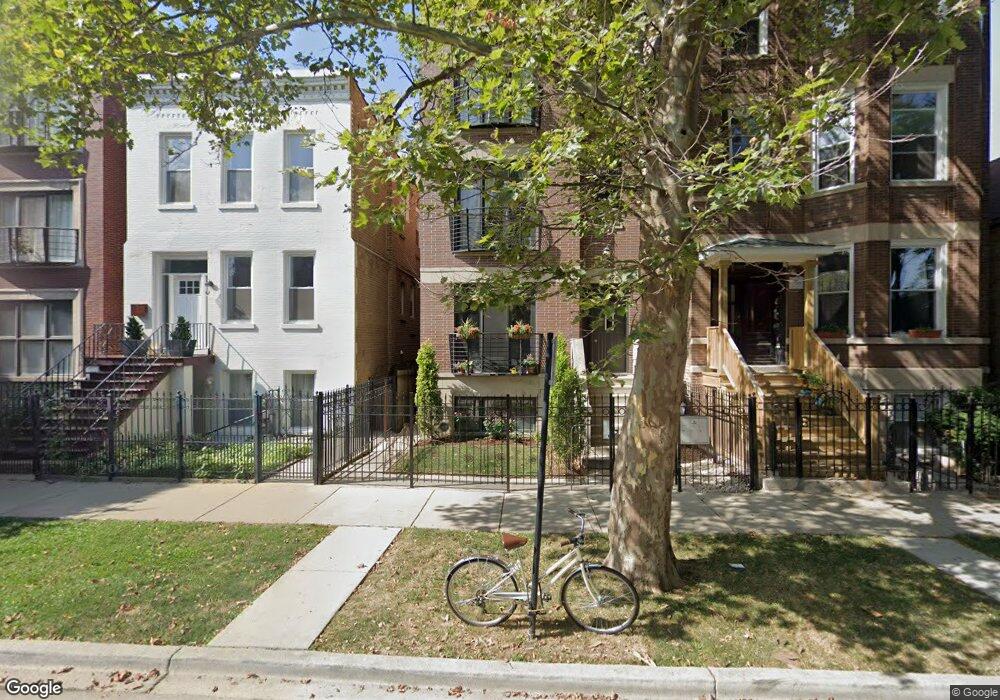
2642 W Cortez St Unit 2 Chicago, IL 60622
Humboldt Park NeighborhoodEstimated Value: $450,062 - $483,000
2
Beds
2
Baths
1,200
Sq Ft
$388/Sq Ft
Est. Value
About This Home
This home is located at 2642 W Cortez St Unit 2, Chicago, IL 60622 and is currently estimated at $465,016, approximately $387 per square foot. 2642 W Cortez St Unit 2 is a home located in Cook County with nearby schools including Chopin Elementary School, Clemente Community Academy High School, and Acero - Esmera Santiago Elementary School.
Ownership History
Date
Name
Owned For
Owner Type
Purchase Details
Closed on
May 19, 2017
Sold by
Wake Heather and Owens Heather
Bought by
Earney Richard
Current Estimated Value
Home Financials for this Owner
Home Financials are based on the most recent Mortgage that was taken out on this home.
Original Mortgage
$260,000
Outstanding Balance
$215,806
Interest Rate
4.03%
Mortgage Type
New Conventional
Estimated Equity
$249,210
Purchase Details
Closed on
Jul 19, 2007
Sold by
Now Development Ii Inc
Bought by
Owens Heather
Home Financials for this Owner
Home Financials are based on the most recent Mortgage that was taken out on this home.
Original Mortgage
$318,000
Interest Rate
6.73%
Mortgage Type
Purchase Money Mortgage
Create a Home Valuation Report for This Property
The Home Valuation Report is an in-depth analysis detailing your home's value as well as a comparison with similar homes in the area
Home Values in the Area
Average Home Value in this Area
Purchase History
| Date | Buyer | Sale Price | Title Company |
|---|---|---|---|
| Earney Richard | $325,000 | First American Title | |
| Owens Heather | $318,000 | None Available |
Source: Public Records
Mortgage History
| Date | Status | Borrower | Loan Amount |
|---|---|---|---|
| Open | Earney Richard | $260,000 | |
| Previous Owner | Owens Heather | $318,000 |
Source: Public Records
Tax History Compared to Growth
Tax History
| Year | Tax Paid | Tax Assessment Tax Assessment Total Assessment is a certain percentage of the fair market value that is determined by local assessors to be the total taxable value of land and additions on the property. | Land | Improvement |
|---|---|---|---|---|
| 2024 | $6,597 | $43,065 | $5,243 | $37,822 |
| 2023 | $6,412 | $31,175 | $2,388 | $28,787 |
| 2022 | $6,412 | $31,175 | $2,388 | $28,787 |
| 2021 | $6,269 | $31,173 | $2,387 | $28,786 |
| 2020 | $6,517 | $29,256 | $2,387 | $26,869 |
| 2019 | $6,501 | $32,357 | $2,387 | $29,970 |
| 2018 | $6,392 | $32,357 | $2,387 | $29,970 |
| 2017 | $6,626 | $30,779 | $2,106 | $28,673 |
| 2016 | $6,165 | $30,779 | $2,106 | $28,673 |
| 2015 | $5,640 | $30,779 | $2,106 | $28,673 |
| 2014 | $4,318 | $23,272 | $1,896 | $21,376 |
| 2013 | $4,233 | $23,272 | $1,896 | $21,376 |
Source: Public Records
Map
Nearby Homes
- 2647 W Cortez St
- 2651 W Augusta Blvd Unit 3
- 2651 W Augusta Blvd Unit 1
- 2714 W Cortez St Unit 1
- 938 N Washtenaw Ave
- 1046 N Rockwell St
- 2708 W Thomas St Unit 2
- 2554 W Augusta Blvd
- 929 N Fairfield Ave
- 2651 W Haddon Ave Unit 1
- 942 N Fairfield Ave Unit 2W
- 936 N Fairfield Ave
- 1045 N California Ave
- 2601 W Haddon Ave Unit 2E
- 2634 W Haddon Ave
- 948 N California Ave
- 2515 W Augusta Blvd Unit 3S
- 2514 W Thomas St
- 1118 N California Ave
- 1005 N Campbell Ave Unit 3
- 2642 W Cortez St Unit 3
- 2642 W Cortez St Unit 1
- 2638 W Cortez St
- 2644 W Cortez St
- 2644 W Cortez St
- 2636 W Cortez St
- 2646 W Cortez St Unit 1
- 2646 W Cortez St Unit 3
- 2646 W Cortez St Unit 2
- 2646 W Cortez St
- 2634 W Cortez St Unit 1
- 2634 W Cortez St Unit G
- 2634 W Cortez St
- 2634 W Cortez St Unit 2F
- 2634 W Cortez St Unit 2R
- 2634 W Cortez St
- 2648 W Cortez St
- 2648 W Cortez St Unit 2
- 2648 W Cortez St Unit 3
- 2614 W Cortez St Unit 1S