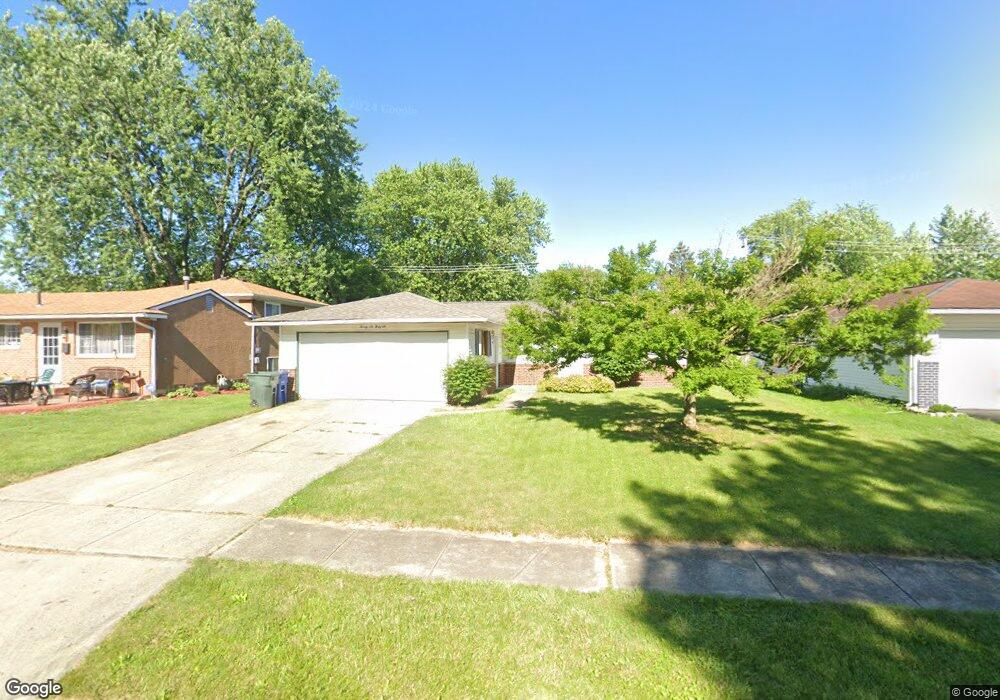
2646 Hubbell Rd Columbus, OH 43232
Walnut Heights NeighborhoodEstimated Value: $216,000 - $328,883
3
Beds
1
Bath
1,239
Sq Ft
$198/Sq Ft
Est. Value
About This Home
This home is located at 2646 Hubbell Rd, Columbus, OH 43232 and is currently estimated at $244,971, approximately $197 per square foot. 2646 Hubbell Rd is a home located in Franklin County with nearby schools including Liberty Elementary School, Yorktown Middle School, and Independence High School.
Ownership History
Date
Name
Owned For
Owner Type
Purchase Details
Closed on
Sep 20, 2015
Sold by
Martom Properties 9 Llc
Bought by
Prattstone Enterprises Lp
Current Estimated Value
Purchase Details
Closed on
Jul 18, 2012
Sold by
Pratt Mark S
Bought by
Martom Properties 9 Llc
Purchase Details
Closed on
Sep 14, 2011
Sold by
Citimortgage Inc
Bought by
Pratt Mark
Purchase Details
Closed on
May 10, 2011
Sold by
Michalak Carla A and Case #10 Cve03004887
Bought by
Citimortgage Inc
Purchase Details
Closed on
Dec 31, 1990
Create a Home Valuation Report for This Property
The Home Valuation Report is an in-depth analysis detailing your home's value as well as a comparison with similar homes in the area
Home Values in the Area
Average Home Value in this Area
Purchase History
| Date | Buyer | Sale Price | Title Company |
|---|---|---|---|
| Prattstone Enterprises Lp | -- | None Available | |
| Martom Properties 9 Llc | $170,000 | None Available | |
| Pratt Mark | $27,500 | Resource T | |
| Citimortgage Inc | $68,000 | None Available | |
| -- | $61,900 | -- |
Source: Public Records
Tax History Compared to Growth
Tax History
| Year | Tax Paid | Tax Assessment Tax Assessment Total Assessment is a certain percentage of the fair market value that is determined by local assessors to be the total taxable value of land and additions on the property. | Land | Improvement |
|---|---|---|---|---|
| 2024 | $2,785 | $59,820 | $17,820 | $42,000 |
| 2023 | $2,707 | $59,815 | $17,815 | $42,000 |
| 2022 | $1,713 | $32,240 | $6,300 | $25,940 |
| 2021 | $1,716 | $32,240 | $6,300 | $25,940 |
| 2020 | $1,719 | $32,240 | $6,300 | $25,940 |
| 2019 | $1,685 | $27,090 | $5,250 | $21,840 |
| 2018 | $1,247 | $27,090 | $5,250 | $21,840 |
| 2017 | $1,288 | $27,090 | $5,250 | $21,840 |
| 2016 | $892 | $13,130 | $4,830 | $8,300 |
| 2015 | $812 | $13,130 | $4,830 | $8,300 |
| 2014 | $814 | $13,130 | $4,830 | $8,300 |
| 2013 | $402 | $13,125 | $4,830 | $8,295 |
Source: Public Records
Map
Nearby Homes
- 2705 Denmark Rd
- 2651 Brownfield Rd
- 5268 Carbondale Dr
- 5278 Glenbriar Ct
- 5114 Carbondale Dr
- 5061 Labelle Dr
- 2447 Maybury Rd
- 5011 Refugee Rd
- 5123 Jameson Dr
- 5144 Botsford Dr
- 2730 Raphael Dr
- 2615 Carbondale Place
- 4906 Refugee Rd
- 2736 Barrows Rd
- 2744 Barrows Rd
- 5373 Spire Ln
- 5377 Bleaker Ave
- 2998 Osgood Rd E
- 5401 Spire Ln
- 5125 Upton Rd N
- 2638 Hubbell Rd
- 2654 Hubbell Rd
- 2630 Hubbell Rd
- 2667 Denmark Rd
- 2660 Hubbell Rd
- 2655 Denmark Rd
- 2673 Denmark Rd
- 2643 Hubbell Rd
- 2651 Hubbell Rd
- 2624 Hubbell Rd
- 2635 Hubbell Rd
- 2666 Hubbell Rd
- 2685 Denmark Rd
- 5176 Maybury Place
- 2639 Denmark Rd
- 2627 Hubbell Rd
- 2699 Denmark Rd
- 2616 Hubbell Rd
- 5185 Maybury Place
- 2633 Denmark Rd