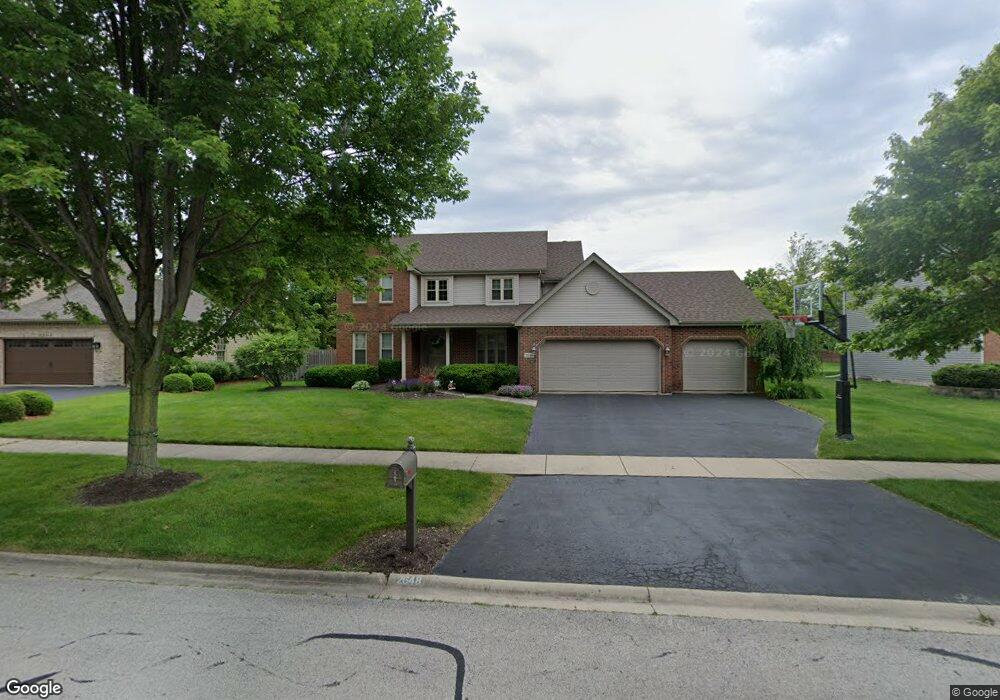
2648 Snowbird Ln Naperville, IL 60564
Crestview Knoll NeighborhoodEstimated Value: $613,391 - $689,000
--
Bed
1
Bath
2,922
Sq Ft
$228/Sq Ft
Est. Value
About This Home
This home is located at 2648 Snowbird Ln, Naperville, IL 60564 and is currently estimated at $667,098, approximately $228 per square foot. 2648 Snowbird Ln is a home located in Will County with nearby schools including Ellsworth Elementary School, Clifford Crone Middle School, and Neuqua Valley High School.
Ownership History
Date
Name
Owned For
Owner Type
Purchase Details
Closed on
Jul 28, 1998
Sold by
Nlsb
Bought by
Thomas Glenn E and Thomas Tracey M
Current Estimated Value
Home Financials for this Owner
Home Financials are based on the most recent Mortgage that was taken out on this home.
Original Mortgage
$227,150
Outstanding Balance
$48,007
Interest Rate
7.07%
Estimated Equity
$619,091
Purchase Details
Closed on
Apr 7, 1995
Sold by
Mcartor Julie
Bought by
First United Bank
Purchase Details
Closed on
Jun 20, 1994
Sold by
First Midwest Trust Company Natl Assn
Bought by
Robert Allen Properties Inc
Home Financials for this Owner
Home Financials are based on the most recent Mortgage that was taken out on this home.
Original Mortgage
$49,425
Interest Rate
8.61%
Create a Home Valuation Report for This Property
The Home Valuation Report is an in-depth analysis detailing your home's value as well as a comparison with similar homes in the area
Home Values in the Area
Average Home Value in this Area
Purchase History
| Date | Buyer | Sale Price | Title Company |
|---|---|---|---|
| Thomas Glenn E | $255,000 | Chicago Title Insurance Co | |
| First United Bank | -- | -- | |
| Mcartor Julie | -- | -- | |
| Robert Allen Properties Inc | $66,000 | Chicago Title Insurance Co |
Source: Public Records
Mortgage History
| Date | Status | Borrower | Loan Amount |
|---|---|---|---|
| Open | Thomas Glenn E | $227,150 | |
| Previous Owner | Robert Allen Properties Inc | $49,425 |
Source: Public Records
Tax History Compared to Growth
Tax History
| Year | Tax Paid | Tax Assessment Tax Assessment Total Assessment is a certain percentage of the fair market value that is determined by local assessors to be the total taxable value of land and additions on the property. | Land | Improvement |
|---|---|---|---|---|
| 2024 | $10,851 | $181,662 | $36,083 | $145,579 |
| 2023 | $10,851 | $160,478 | $31,875 | $128,603 |
| 2022 | $11,877 | $169,925 | $30,154 | $139,771 |
| 2021 | $11,351 | $161,833 | $28,718 | $133,115 |
| 2020 | $11,135 | $159,269 | $28,263 | $131,006 |
| 2019 | $10,944 | $154,780 | $27,466 | $127,314 |
| 2018 | $11,015 | $153,045 | $26,861 | $126,184 |
| 2017 | $10,847 | $149,094 | $26,168 | $122,926 |
| 2016 | $10,826 | $145,885 | $25,605 | $120,280 |
| 2015 | $10,666 | $140,274 | $24,620 | $115,654 |
| 2014 | $10,666 | $133,541 | $24,620 | $108,921 |
| 2013 | $10,666 | $133,541 | $24,620 | $108,921 |
Source: Public Records
Map
Nearby Homes
- 29W316 Andermann Dr
- 3707 Junebreeze Ln
- 2255 Wendt Cir
- 3281 Cool Springs Ct
- 3432 Redwing Dr Unit 2
- 1736 Robert Ln
- 1804 Princess Cir
- 2711 Wait Rd
- 3420 Sunnyside Ct
- 3423 Sunnyside Ct
- 3616 Eliot Ln
- 3003 Kingbird Ct Unit IV
- 24531 W 103rd St
- 2866 Stonewater Dr Unit 102
- 3421 Goldfinch Dr
- 3349 Rosecroft Ln Unit 2
- 2207 Sisters Ave
- 3408 Parliament Ln Unit 1
- 2949 Brossman St
- 3311 Fairmont Ave
- 2644 Snowbird Ln Unit 1
- 2652 Snowbird Ln
- 3904 Nighthawk Ct
- 3903 Nighthawk Ct
- 2640 Snowbird Ln
- 3908 Falcon Dr
- 3908 Nighthawk Ct
- 2647 Snowbird Ln
- 2651 Snowbird Ln Unit 1
- 3912 Falcon Dr
- 2655 Snowbird Ln
- 2643 Snowbird Ln
- 3907 Nighthawk Ct
- 2628 Snowbird Ln
- 2659 Snowbird Ln
- 2639 Snowbird Ln
- 2620 Snowbird Ln
- 3912 Nighthawk Ct
- 3920 Falcon Dr
- 2616 Snowbird Ln