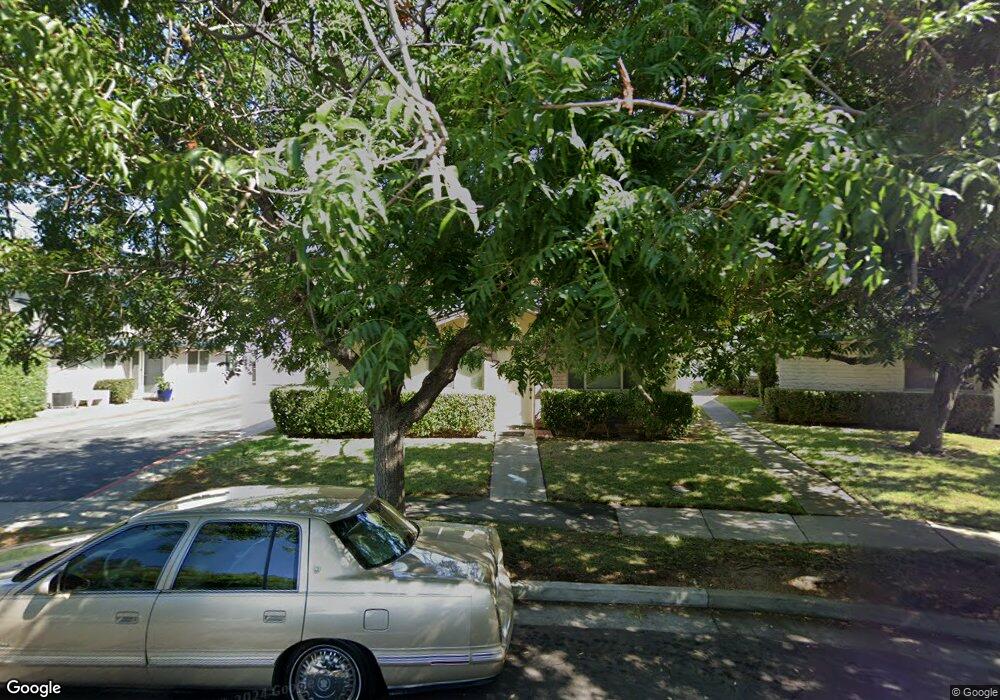
265 Gomes Ct Unit 4 Campbell, CA 95008
Downtown Campbell NeighborhoodEstimated Value: $602,000 - $728,000
2
Beds
1
Bath
798
Sq Ft
$807/Sq Ft
Est. Value
About This Home
This home is located at 265 Gomes Ct Unit 4, Campbell, CA 95008 and is currently estimated at $643,955, approximately $806 per square foot. 265 Gomes Ct Unit 4 is a home located in Santa Clara County with nearby schools including Rosemary Elementary School, Del Mar High School, and Campbell School of Innovation.
Ownership History
Date
Name
Owned For
Owner Type
Purchase Details
Closed on
Mar 23, 2016
Sold by
Sim Tom and Men Vannath
Bought by
Men Vannath
Current Estimated Value
Purchase Details
Closed on
Aug 28, 1997
Sold by
Ford Barry A
Bought by
Sim Tom and Men Vannath
Home Financials for this Owner
Home Financials are based on the most recent Mortgage that was taken out on this home.
Original Mortgage
$106,400
Outstanding Balance
$16,417
Interest Rate
7.42%
Estimated Equity
$627,538
Purchase Details
Closed on
Jul 22, 1997
Sold by
Moffett Michael J and Moffett Patricia L
Bought by
Ford Barry A
Home Financials for this Owner
Home Financials are based on the most recent Mortgage that was taken out on this home.
Original Mortgage
$106,400
Outstanding Balance
$16,417
Interest Rate
7.42%
Estimated Equity
$627,538
Create a Home Valuation Report for This Property
The Home Valuation Report is an in-depth analysis detailing your home's value as well as a comparison with similar homes in the area
Home Values in the Area
Average Home Value in this Area
Purchase History
We collect this data history from publicly available records. To have your information removed, we recommend requesting removal directly through your county’s website.
| Date | Buyer | Sale Price | Title Company |
|---|---|---|---|
| Men Vannath | -- | None Available | |
| Sim Tom | $133,000 | Stewart Title | |
| Ford Barry A | -- | Stewart Title | |
| Ford Barry A | $133,000 | Stewart Title |
Source: Public Records
Mortgage History
We collect this data history from publicly available records. To have your information removed, we recommend requesting removal directly through your county’s website.
| Date | Status | Borrower | Loan Amount |
|---|---|---|---|
| Open | Sim Tom | $106,400 |
Source: Public Records
Tax History
| Year | Tax Paid | Tax Assessment Tax Assessment Total Assessment is a certain percentage of the fair market value that is determined by local assessors to be the total taxable value of land and additions on the property. | Land | Improvement |
|---|---|---|---|---|
| 2025 | $3,441 | $212,340 | $79,824 | $132,516 |
| 2024 | $3,441 | $208,177 | $78,259 | $129,918 |
| 2023 | $3,403 | $204,096 | $76,725 | $127,371 |
| 2022 | $3,440 | $200,095 | $75,221 | $124,874 |
| 2021 | $3,361 | $196,173 | $73,747 | $122,426 |
| 2020 | $3,262 | $194,162 | $72,991 | $121,171 |
| 2019 | $3,203 | $190,356 | $71,560 | $118,796 |
| 2018 | $3,099 | $186,624 | $70,157 | $116,467 |
| 2017 | $3,040 | $182,966 | $68,782 | $114,184 |
| 2016 | $2,772 | $179,380 | $67,434 | $111,946 |
| 2015 | $2,700 | $176,687 | $66,422 | $110,265 |
| 2014 | $2,537 | $173,227 | $65,121 | $108,106 |
Source: Public Records
Map
Nearby Homes
- 283 Esther Ave
- 188 Harrison Ave
- 1481 Pompey Dr
- 1454 Merry Ln
- 155 W Rosemary Ln
- 407 Lawndale Ave
- 207 E Rincon Ave
- 89 E Rincon Ave
- 2949 Driftwood Dr
- 801 Monica Ln
- 313 N Milton Ave
- 3128 Loma Verde Dr Unit 219
- 111 George Ct
- 616 Sunsweet Way
- 204 Hardy Ave
- 101 Sunnyside Ave
- 124 Lottie Ln
- 3364 Merrimac Dr
- 56 Sunnyside Ave
- 44 Sunnyside Ave
- 234 Gomes Ct Unit 4
- 234 Gomes Ct Unit 3
- 234 Gomes Ct Unit 2
- 234 Gomes Ct Unit 1
- 244 Gomes Ct Unit 4
- 244 Gomes Ct Unit 3
- 244 Gomes Ct Unit 1
- 214 Gomes Ct Unit 4
- 214 Gomes Ct Unit 3
- 214 Gomes Ct Unit 2
- 214 Gomes Ct Unit 1
- 323 N 2nd St Unit 4
- 323 N 2nd St Unit 3
- 323 N 2nd St Unit 2
- 323 N 2nd St Unit 1
- 314 N 3rd St Unit 3
- 314 N 3rd St Unit 2
- 314 N 3rd St Unit 1
- 210 Gomes Ct Unit 4
- 210 Gomes Ct Unit 3
Your Personal Tour Guide
Ask me questions while you tour the home.