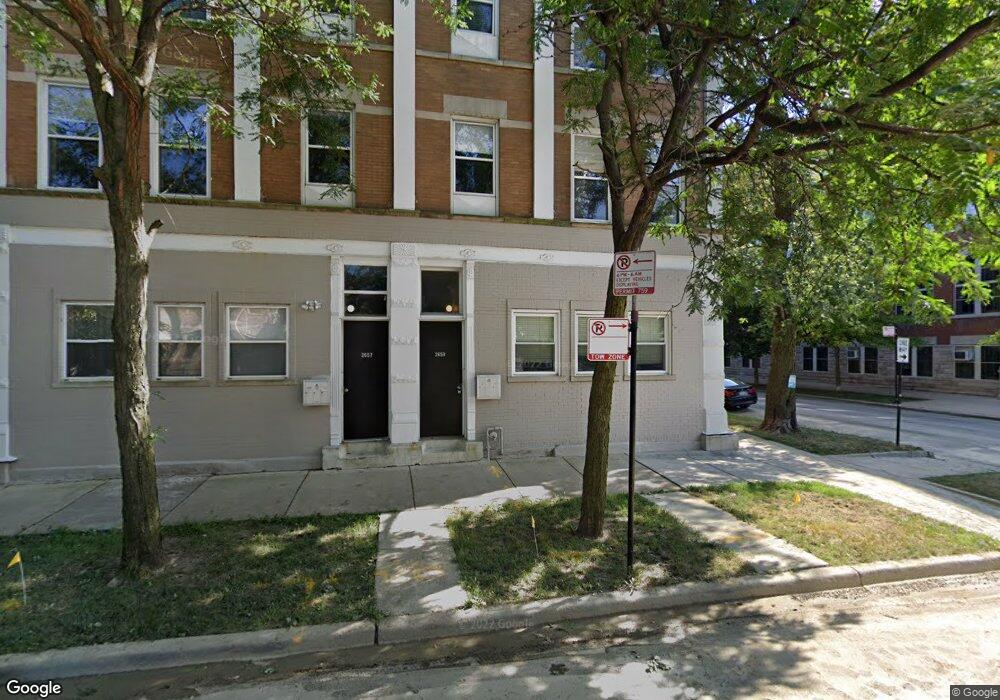
2659 W Cortez St Unit 1 Chicago, IL 60622
Humboldt Park NeighborhoodEstimated Value: $276,000 - $388,000
2
Beds
1
Bath
12,249
Sq Ft
$27/Sq Ft
Est. Value
About This Home
This home is located at 2659 W Cortez St Unit 1, Chicago, IL 60622 and is currently estimated at $325,508, approximately $26 per square foot. 2659 W Cortez St Unit 1 is a home located in Cook County with nearby schools including Chopin Elementary School, Clemente Community Academy High School, and Acero - Esmera Santiago Elementary School.
Ownership History
Date
Name
Owned For
Owner Type
Purchase Details
Closed on
Oct 10, 2017
Sold by
Castillo Flores Alicia
Bought by
Peterson Hannah W
Current Estimated Value
Home Financials for this Owner
Home Financials are based on the most recent Mortgage that was taken out on this home.
Original Mortgage
$195,035
Outstanding Balance
$163,127
Interest Rate
3.87%
Mortgage Type
New Conventional
Estimated Equity
$162,381
Purchase Details
Closed on
Aug 13, 2008
Sold by
1015 N Washtenaw Llc
Bought by
Castillo Flores Alicia A
Home Financials for this Owner
Home Financials are based on the most recent Mortgage that was taken out on this home.
Original Mortgage
$177,300
Interest Rate
6.42%
Mortgage Type
Unknown
Create a Home Valuation Report for This Property
The Home Valuation Report is an in-depth analysis detailing your home's value as well as a comparison with similar homes in the area
Home Values in the Area
Average Home Value in this Area
Purchase History
| Date | Buyer | Sale Price | Title Company |
|---|---|---|---|
| Peterson Hannah W | $205,500 | Fidelity National Title | |
| Castillo Flores Alicia A | $197,000 | Chicago Title Insurance Co |
Source: Public Records
Mortgage History
| Date | Status | Borrower | Loan Amount |
|---|---|---|---|
| Open | Peterson Hannah W | $195,035 | |
| Previous Owner | Castillo Flores Alicia A | $177,300 |
Source: Public Records
Tax History Compared to Growth
Tax History
| Year | Tax Paid | Tax Assessment Tax Assessment Total Assessment is a certain percentage of the fair market value that is determined by local assessors to be the total taxable value of land and additions on the property. | Land | Improvement |
|---|---|---|---|---|
| 2024 | $4,876 | $22,020 | $2,745 | $19,275 |
| 2023 | $4,740 | $23,044 | $1,250 | $21,794 |
| 2022 | $4,740 | $23,044 | $1,250 | $21,794 |
| 2021 | $4,634 | $23,043 | $1,249 | $21,794 |
| 2020 | $3,762 | $16,889 | $1,249 | $15,640 |
| 2019 | $3,753 | $18,679 | $1,249 | $17,430 |
| 2018 | $3,690 | $18,679 | $1,249 | $17,430 |
| 2017 | $2,876 | $16,734 | $1,102 | $15,632 |
| 2016 | $2,852 | $16,734 | $1,102 | $15,632 |
| 2015 | $3,188 | $20,023 | $1,102 | $18,921 |
| 2014 | $2,521 | $16,158 | $992 | $15,166 |
| 2013 | $2,460 | $16,158 | $992 | $15,166 |
Source: Public Records
Map
Nearby Homes
- 2627 W Thomas St Unit 1
- 2651 W Augusta Blvd Unit 3
- 2651 W Augusta Blvd Unit 1
- 1046 N Rockwell St
- 2714 W Cortez St Unit 1
- 2554 W Augusta Blvd
- 2708 W Thomas St Unit 2
- 938 N Washtenaw Ave
- 2651 W Haddon Ave Unit 1
- 2601 W Haddon Ave Unit 2E
- 2634 W Haddon Ave
- 929 N Fairfield Ave
- 942 N Fairfield Ave Unit 2W
- 936 N Fairfield Ave
- 1045 N California Ave
- 2515 W Augusta Blvd Unit 3S
- 2514 W Thomas St
- 948 N California Ave
- 2456 W Cortez St Unit 3E
- 2456 W Cortez St Unit 2E
- 2659 W Cortez St Unit 26592
- 2659 W Cortez St Unit 26591
- 2659 W Cortez St Unit 26593
- 2659 W Cortez St Unit 2
- 2643 W Cortez St
- 2639 W Cortez St Unit 1
- 2637 W Cortez St Unit 3
- 2637 W Cortez St Unit 2
- 2637 W Cortez St Unit 1
- 2635 W Cortez St Unit 2
- 2635 W Cortez St Unit 1
- 2635 W Cortez St Unit 3
- 2635 W Cortez St
- 2645 W Cortez St
- 2614 W Cortez St Unit 1S
- 2614 W Cortez St Unit 3
- 2614 W Cortez St Unit 1N
- 2614 W Cortez St Unit 2
- 2629 W Cortez St Unit 1
- 2647 W Cortez St