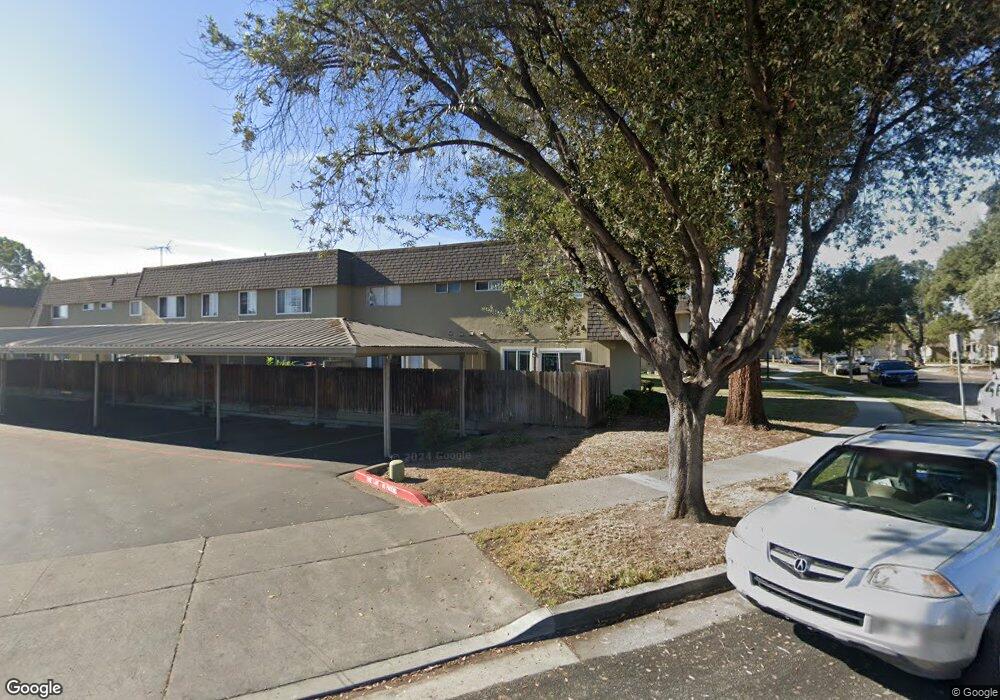
2661 Ponselle Ct San Jose, CA 95121
Leyva NeighborhoodEstimated Value: $577,000 - $699,000
2
Beds
2
Baths
988
Sq Ft
$623/Sq Ft
Est. Value
About This Home
This home is located at 2661 Ponselle Ct, San Jose, CA 95121 and is currently estimated at $615,253, approximately $622 per square foot. 2661 Ponselle Ct is a home located in Santa Clara County with nearby schools including O.B. Whaley Elementary School, George V. Leyva Intermediate School, and Yerba Buena High School.
Ownership History
Date
Name
Owned For
Owner Type
Purchase Details
Closed on
Jun 18, 2021
Sold by
Nguyen Niem and Nguyen Huong Thi
Bought by
Nguyen Niem Duy and Nguyen Huong Thi
Current Estimated Value
Purchase Details
Closed on
Nov 24, 2014
Sold by
Nguyen Niem
Bought by
Nguyen Niem and Nguyen Huong Thi Kim
Home Financials for this Owner
Home Financials are based on the most recent Mortgage that was taken out on this home.
Original Mortgage
$155,000
Outstanding Balance
$52,598
Interest Rate
3.95%
Mortgage Type
New Conventional
Estimated Equity
$562,655
Purchase Details
Closed on
Sep 30, 2009
Sold by
Nguyen Huong Thi Kim
Bought by
Nguyen Niem
Home Financials for this Owner
Home Financials are based on the most recent Mortgage that was taken out on this home.
Original Mortgage
$128,000
Interest Rate
5.14%
Mortgage Type
New Conventional
Purchase Details
Closed on
Sep 18, 2009
Sold by
Fannie Mae
Bought by
Nguyen Niem
Home Financials for this Owner
Home Financials are based on the most recent Mortgage that was taken out on this home.
Original Mortgage
$128,000
Interest Rate
5.14%
Mortgage Type
New Conventional
Purchase Details
Closed on
May 20, 2009
Sold by
Nunez Ana Laura and Vargas Eduardo
Bought by
Federal National Mortgage Association
Purchase Details
Closed on
Sep 18, 2007
Sold by
Chen Benjamin
Bought by
Vargas Eduardo and Nunez Ana Laura
Home Financials for this Owner
Home Financials are based on the most recent Mortgage that was taken out on this home.
Original Mortgage
$54,600
Interest Rate
6.4%
Mortgage Type
Credit Line Revolving
Purchase Details
Closed on
Jul 3, 2002
Sold by
Tran Chihn M and Tran Elaine
Bought by
Chen Benjamin
Home Financials for this Owner
Home Financials are based on the most recent Mortgage that was taken out on this home.
Original Mortgage
$192,000
Interest Rate
5%
Purchase Details
Closed on
Feb 9, 2001
Sold by
Nguyen Vong Huu
Bought by
Tran Chinh M
Home Financials for this Owner
Home Financials are based on the most recent Mortgage that was taken out on this home.
Original Mortgage
$256,500
Interest Rate
7.08%
Purchase Details
Closed on
Feb 6, 2001
Sold by
Tran Elaine
Bought by
Tran Chinh M
Home Financials for this Owner
Home Financials are based on the most recent Mortgage that was taken out on this home.
Original Mortgage
$256,500
Interest Rate
7.08%
Create a Home Valuation Report for This Property
The Home Valuation Report is an in-depth analysis detailing your home's value as well as a comparison with similar homes in the area
Home Values in the Area
Average Home Value in this Area
Purchase History
| Date | Buyer | Sale Price | Title Company |
|---|---|---|---|
| Nguyen Niem Duy | -- | None Available | |
| Nguyen Niem | -- | Old Republic Title Company | |
| Nguyen Niem | -- | Landsafe Title Company | |
| Nguyen Niem | $160,000 | Chicago Title Company | |
| Federal National Mortgage Association | $307,106 | Accommodation | |
| Vargas Eduardo | $375,000 | Chicago Title Company | |
| Chen Benjamin | $240,000 | Old Republic Title Company | |
| Tran Chinh M | $270,000 | Financial Title Company | |
| Tran Chinh M | -- | Financial Title Company |
Source: Public Records
Mortgage History
| Date | Status | Borrower | Loan Amount |
|---|---|---|---|
| Open | Nguyen Niem | $155,000 | |
| Closed | Nguyen Niem | $128,000 | |
| Previous Owner | Vargas Eduardo | $54,600 | |
| Previous Owner | Vargas Eduardo | $291,200 | |
| Previous Owner | Chen Benjamin | $192,000 | |
| Previous Owner | Tran Chinh M | $256,500 |
Source: Public Records
Tax History
| Year | Tax Paid | Tax Assessment Tax Assessment Total Assessment is a certain percentage of the fair market value that is determined by local assessors to be the total taxable value of land and additions on the property. | Land | Improvement |
|---|---|---|---|---|
| 2025 | $4,091 | $206,520 | $103,260 | $103,260 |
| 2024 | $4,091 | $202,472 | $101,236 | $101,236 |
| 2023 | $3,977 | $198,502 | $99,251 | $99,251 |
| 2022 | $3,948 | $194,610 | $97,305 | $97,305 |
| 2021 | $3,920 | $190,796 | $95,398 | $95,398 |
| 2020 | $3,735 | $188,840 | $94,420 | $94,420 |
| 2019 | $3,624 | $185,138 | $92,569 | $92,569 |
| 2018 | $3,553 | $181,508 | $90,754 | $90,754 |
| 2017 | $3,492 | $177,950 | $88,975 | $88,975 |
| 2016 | $3,330 | $174,462 | $87,231 | $87,231 |
| 2015 | $3,280 | $171,842 | $85,921 | $85,921 |
| 2014 | $2,707 | $168,476 | $84,238 | $84,238 |
Source: Public Records
Map
Nearby Homes
- 2582 Tosca Way
- 1314 Pellier Ct
- 1322 Becket Dr
- 2690 Mclaughlin Ave
- 2825 Aetna Way
- 2651 Ophelia Ave
- 2739 Mclaughlin Ave
- 1079 Drexel Way
- 3016 Shadow Springs Place Unit 113
- 2698 Kendrick Cir
- 3135 Oakbridge Dr Unit 3135
- 2252 Denair Ave
- 2372 Balme Dr
- 3241 Shadow Park Place
- 2606 Apollo Dr
- 1371 Sunnycrest Cir
- 2130 Pastoral Loop
- 2149 Pastoral Loop
- 2216 Tampa Way
- 3032 Oakbridge Dr Unit 3032
- 2663 Ponselle Ct
- 2665 Ponselle Ct
- 2667 Ponselle Ct
- 2669 Ponselle Ct
- 2652 Salome Ct
- 2671 Ponselle Ct
- 2656 Salome Ct
- 2658 Salome Ct
- 2662 Salome Ct
- 2647 Faust Ct
- 2668 Ponselle Ct
- 2664 Salome Ct
- 2675 Ponselle Ct
- 2670 Ponselle Ct
- 2654 Faust Ct
- 2645 Faust Ct
- 2677 Ponselle Ct
- 2644 Tannhauser Ct
- 2672 Ponselle Ct
- 2652 Faust Ct
Your Personal Tour Guide
Ask me questions while you tour the home.