Estimated Value: $392,000 - $471,000
2
Beds
2
Baths
1,188
Sq Ft
$356/Sq Ft
Est. Value
About This Home
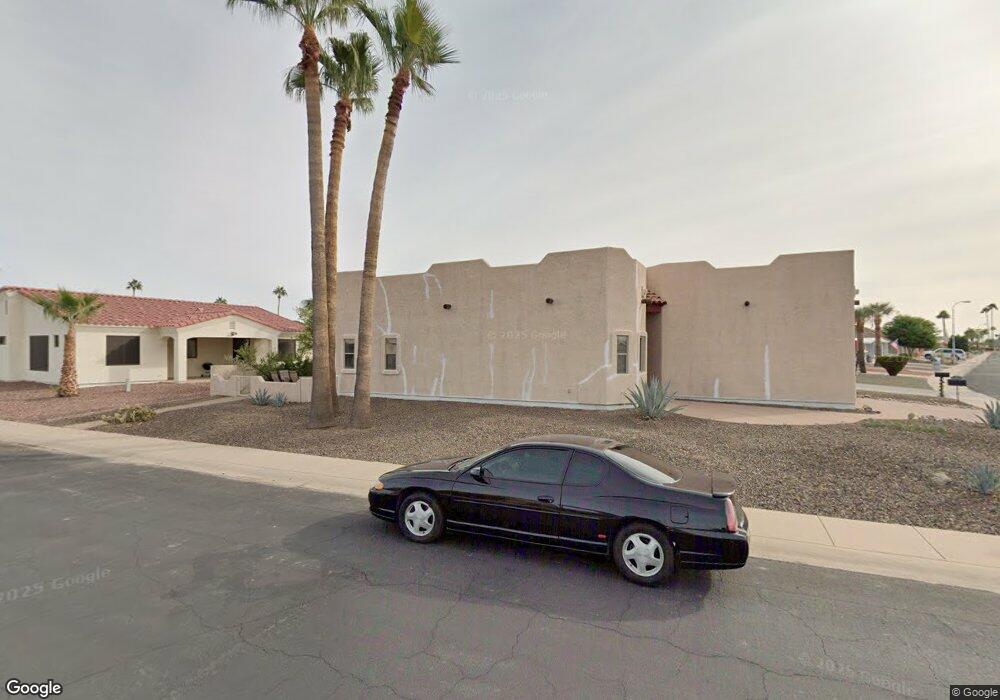
This home is located at 2669 N Armour Ave, Mesa, AZ 85215 and is currently estimated at $423,220, approximately $356 per square foot. 2669 N Armour Ave is a home located in Maricopa County with nearby schools including Bush Elementary School, Franklin at Brimhall Elementary School, and Franklin West Elementary School.
Ownership History
Date
Name
Owned For
Owner Type
Purchase Details
Closed on
Apr 1, 2009
Sold by
Clark Annmarie C and Carroll Annmarie C
Bought by
Lange Kerry P and Lange Christine A
Current Estimated Value
Purchase Details
Closed on
Jun 14, 2004
Sold by
Carroll Vincent A
Bought by
Carroll Annmarie C
Home Financials for this Owner
Home Financials are based on the most recent Mortgage that was taken out on this home.
Original Mortgage
$117,900
Interest Rate
6.27%
Mortgage Type
New Conventional
Purchase Details
Closed on
Aug 23, 2001
Sold by
Cudney Maureen
Bought by
Carroll Vincent A and Carroll Annmarie C
Home Financials for this Owner
Home Financials are based on the most recent Mortgage that was taken out on this home.
Original Mortgage
$116,000
Interest Rate
6.91%
Mortgage Type
Seller Take Back
Create a Home Valuation Report for This Property
The Home Valuation Report is an in-depth analysis detailing your home's value as well as a comparison with similar homes in the area
Purchase History
We collect this data history from publicly available records. To have your information removed, we recommend requesting removal directly through your county’s website.
| Date | Buyer | Sale Price | Title Company |
|---|---|---|---|
| Lange Kerry P | $146,500 | Chicago Title | |
| Carroll Annmarie C | -- | Transnation Title | |
| Carroll Vincent A | $36,000 | Transnation Title Insurance |
Source: Public Records
Mortgage History
We collect this data history from publicly available records. To have your information removed, we recommend requesting removal directly through your county’s website.
| Date | Status | Borrower | Loan Amount |
|---|---|---|---|
| Previous Owner | Carroll Annmarie C | $117,900 | |
| Previous Owner | Carroll Vincent A | $116,000 |
Source: Public Records
Tax History
| Year | Tax Paid | Tax Assessment Tax Assessment Total Assessment is a certain percentage of the fair market value that is determined by local assessors to be the total taxable value of land and additions on the property. | Land | Improvement |
|---|---|---|---|---|
| 2025 | $2,212 | $21,974 | -- | -- |
| 2024 | $2,231 | $20,928 | -- | -- |
| 2023 | $2,231 | $30,550 | $6,110 | $24,440 |
| 2022 | $2,177 | $24,880 | $4,970 | $19,910 |
| 2021 | $2,203 | $22,610 | $4,520 | $18,090 |
| 2020 | $2,172 | $21,250 | $4,250 | $17,000 |
| 2019 | $2,039 | $18,930 | $3,780 | $15,150 |
| 2018 | $1,959 | $15,970 | $3,190 | $12,780 |
| 2017 | $1,907 | $15,660 | $3,130 | $12,530 |
| 2016 | $1,867 | $15,610 | $3,120 | $12,490 |
| 2015 | $1,754 | $15,850 | $3,170 | $12,680 |
Source: Public Records
Map
Nearby Homes
- 2716 N Lema Dr
- 2653 N Armour Ave
- 2653 N Hogan Ave
- 2664 N Lema Dr
- 5263 E Mcdowell Rd
- 2565 N Armour Ave
- 2617 N Trevino Place
- 2541 N Hogan Ave
- 5546 E Player Place
- 2435 N Higley Rd
- 2505 N Trevino Place
- 2516 N 56th St
- 5424 E Hermosa Vista Dr
- 2360 N Nicklaus Dr
- 2511 N 56th St
- 2347 N Nicklaus Dr
- 2374 N Nicklaus Dr
- 5652 E Player Place
- 2465 N Snead Dr
- 433 E Navajo Unit 145
- 2665 N Armour Ave
- 2674 N Hogan Ave
- 2668 N Hogan Ave
- 2657 N Armour Ave
- 2666 N Armour Ave
- 2714 N Lema Dr
- 2662 N Hogan Ave
- 2710 N Lema Dr
- 2656 N Hogan Ave
- 2720 N Lema Dr
- 2654 N Armour Ave
- 2650 N Hogan Ave
- 2706 N Lema Dr
- 2647 N Armour Ave
- 2722 N Lema Dr
- 2663 N Hogan Ave
- 2657 N Lema Dr
- 2659 N Hogan Ave
- 2723 N Lema Dr
- 2704 N Lema Dr
Your Personal Tour Guide
Ask me questions while you tour the home.