Estimated Value: $2,204,577 - $2,664,000
About This Home
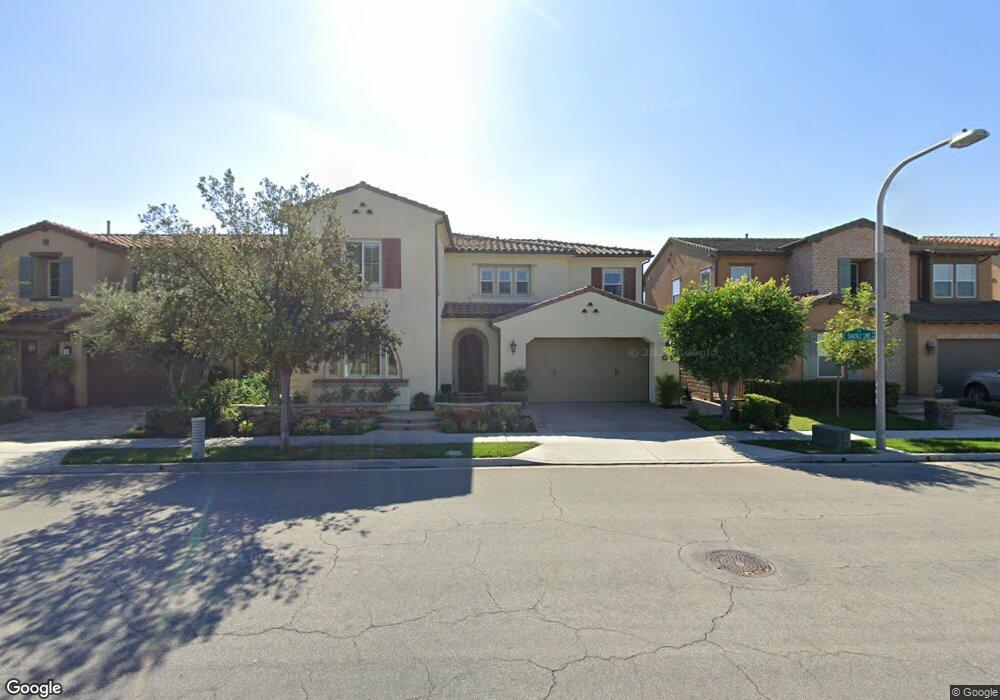
This home is located at 2680 E Temblor Ranch Dr, Brea, CA 92821 and is currently estimated at $2,460,144, approximately $654 per square foot. 2680 E Temblor Ranch Dr is a home located in Orange County with nearby schools including Olinda Elementary School, Brea Junior High School, and Brea-Olinda High School.
Ownership History
We collect this data history from publicly available records. To have your information removed, we recommend requesting removal directly through your county’s website.
Purchase Details
Home Financials for this Owner
Home Financials are based on the most recent Mortgage that was taken out on this home.Purchase Details
Home Financials for this Owner
Home Financials are based on the most recent Mortgage that was taken out on this home.Home Values in the Area
Average Home Value in this Area
Purchase History
We collect this data history from publicly available records. To have your information removed, we recommend requesting removal directly through your county’s website.
| Date | Buyer | Sale Price | Title Company |
|---|---|---|---|
| -- | Accommodation | ||
| -- | Fidelity National Title Co | ||
| $1,204,500 | First American Title Nhs |
Mortgage History
We collect this data history from publicly available records. To have your information removed, we recommend requesting removal directly through your county’s website.
| Date | Status | Borrower | Loan Amount |
|---|---|---|---|
| Open | $250,000 | ||
| Open | $475,000 |
Tax History
We collect this data history from publicly available records. To have your information removed, we recommend requesting removal directly through your county’s website.
| Year | Tax Paid | Tax Assessment Tax Assessment Total Assessment is a certain percentage of the fair market value that is determined by local assessors to be the total taxable value of land and additions on the property. | Land | Improvement |
|---|---|---|---|---|
| 2025 | $17,766 | $1,476,455 | $715,981 | $760,474 |
| 2024 | $17,766 | $1,447,505 | $701,942 | $745,563 |
| 2023 | $17,292 | $1,419,123 | $688,178 | $730,945 |
| 2022 | $17,125 | $1,391,298 | $674,685 | $716,613 |
| 2021 | $16,799 | $1,364,018 | $661,456 | $702,562 |
| 2020 | $16,670 | $1,350,032 | $654,673 | $695,359 |
| 2019 | $16,218 | $1,323,561 | $641,836 | $681,725 |
| 2018 | $15,966 | $1,297,609 | $629,251 | $668,358 |
| 2017 | $15,660 | $1,272,166 | $616,913 | $655,253 |
| 2016 | $15,346 | $1,247,222 | $604,817 | $642,405 |
| 2015 | $15,126 | $1,228,488 | $595,732 | $632,756 |
| 2014 | $14,696 | $1,204,424 | $584,062 | $620,362 |
Map
- 2583 Sandpebble Ln
- 2425 E Kern River Ln
- 2377 Sommerset Dr
- 2976 E Coalinga Dr
- 158 N Thistle Rd
- 198 Sunflower St
- 137 S Thistle Rd
- 3174 E Piru Ln
- 2282 Shadetree Cir
- 2257 Shadetree Cir
- 2407 Branch Ln
- 2998 Primrose Ave
- 2304 Carrotwood Dr
- 109 Cinnamon Ridge Rd
- 2440 Sanabria Ln
- 3624 Skylark Way
- 562 Condor Ave
- 431 Blue Jay Dr
- 220 Buena Vida Dr Unit 308
- 3336 Adelante St
- 2683 E Ojai Dr
- 2697 E Ojai Dr
- 2669 E Ojai Dr
- 2686 E Ojai Dr
- 2705 E Ojai Dr
- 2641 E Ojai Dr
- 2674 E Ojai Dr
- 2698 E Ojai Dr
- 2662 E Ojai Dr
- 2625 E Ojai Dr
- 2719 E Ojai Dr
- 2640 E Ojai Dr
- 2710 E Ojai Dr
- 2664 E Temblor Ranch Dr
- 2628 E Ojai Dr
- 2694 E Temblor Ranch Dr
- 2652 E Temblor Ranch Dr
- 2613 E Ojai Dr
- 2722 E Ojai Dr
- 2708 E Temblor Ranch Dr
Ask me questions while you tour the home.