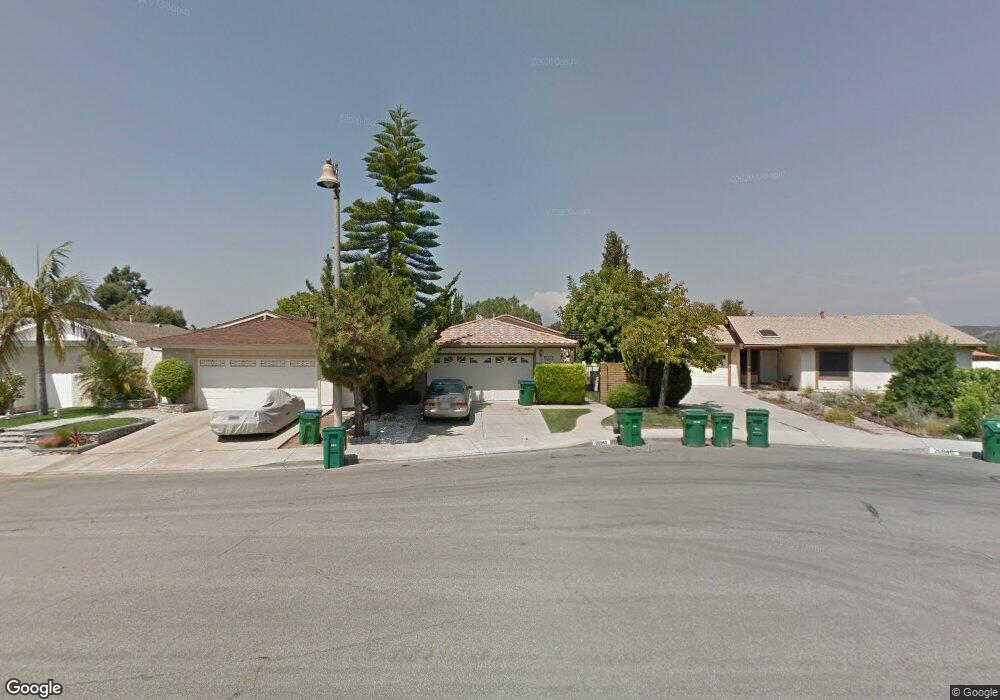
26942 Colmenar Mission Viejo, CA 92692
Estimated Value: $964,572 - $1,186,000
3
Beds
2
Baths
1,120
Sq Ft
$946/Sq Ft
Est. Value
About This Home
This home is located at 26942 Colmenar, Mission Viejo, CA 92692 and is currently estimated at $1,059,893, approximately $946 per square foot. 26942 Colmenar is a home located in Orange County with nearby schools including Carl Hankey Middle School, Capistrano Valley High School, and Mission Montessori.
Ownership History
Date
Name
Owned For
Owner Type
Purchase Details
Closed on
May 18, 2009
Sold by
Countrywide Bank Fsb
Bought by
Zandbiglari Shohreh
Current Estimated Value
Purchase Details
Closed on
Sep 5, 2008
Sold by
Martinez Carmelo A
Bought by
Countrywide Bank Fsb
Purchase Details
Closed on
Jun 16, 2005
Sold by
Yu Packard Joe and Yu Rose
Bought by
Martinez Carmelo A
Home Financials for this Owner
Home Financials are based on the most recent Mortgage that was taken out on this home.
Original Mortgage
$468,000
Interest Rate
1.75%
Mortgage Type
Negative Amortization
Purchase Details
Closed on
May 13, 2005
Sold by
Shum Joe W and Shum Grace M
Bought by
Yu Packard Joe and Yu Rose
Home Financials for this Owner
Home Financials are based on the most recent Mortgage that was taken out on this home.
Original Mortgage
$468,000
Interest Rate
1.75%
Mortgage Type
Negative Amortization
Create a Home Valuation Report for This Property
The Home Valuation Report is an in-depth analysis detailing your home's value as well as a comparison with similar homes in the area
Home Values in the Area
Average Home Value in this Area
Purchase History
| Date | Buyer | Sale Price | Title Company |
|---|---|---|---|
| Zandbiglari Shohreh | $378,000 | Landsafe Title | |
| Zandbiglari Shohreh | -- | Landsafe Title | |
| Countrywide Bank Fsb | $387,000 | Landsafe Title | |
| Martinez Carmelo A | $585,000 | New Century Title Company | |
| Yu Packard Joe | -- | New Century Title Company | |
| Yu Packard Joe | $600,000 | New Century Title Company |
Source: Public Records
Mortgage History
| Date | Status | Borrower | Loan Amount |
|---|---|---|---|
| Previous Owner | Martinez Carmelo A | $468,000 |
Source: Public Records
Tax History Compared to Growth
Tax History
| Year | Tax Paid | Tax Assessment Tax Assessment Total Assessment is a certain percentage of the fair market value that is determined by local assessors to be the total taxable value of land and additions on the property. | Land | Improvement |
|---|---|---|---|---|
| 2025 | $4,848 | $486,765 | $399,003 | $87,762 |
| 2024 | $4,848 | $477,221 | $391,179 | $86,042 |
| 2023 | $4,745 | $467,864 | $383,509 | $84,355 |
| 2022 | $4,655 | $458,691 | $375,990 | $82,701 |
| 2021 | $4,565 | $449,698 | $368,618 | $81,080 |
| 2020 | $4,520 | $445,087 | $364,838 | $80,249 |
| 2019 | $4,431 | $436,360 | $357,684 | $78,676 |
| 2018 | $4,346 | $427,804 | $350,670 | $77,134 |
| 2017 | $4,261 | $419,416 | $343,794 | $75,622 |
| 2016 | $4,180 | $411,193 | $337,053 | $74,140 |
| 2015 | $4,133 | $405,017 | $331,990 | $73,027 |
| 2014 | $4,054 | $397,084 | $325,487 | $71,597 |
Source: Public Records
Map
Nearby Homes
- 26998 El Retiro
- 26848 Park Terrace Ln Unit 130
- 26896 Park Terrace Ln Unit 229
- 26766 Baronet
- 27075 La Fuente
- 26732 Trasmiras
- 26611 Strafford
- 26611 Loma Verde
- 27533 Calinda
- 26562 Via Mondelo
- 26466 San Torini Rd
- 26972 Venado Dr
- 26646 Guadiana
- 26635 Guadiana
- 26192 Golada
- 26914 Jasper Unit 254
- 26516 El Mar Dr
- 33 Chadron Cir Unit 120
- 26611 Dorothea
- 26562 Lucinda
- 26936 Colmenar
- 26946 Colmenar
- 26932 Colmenar
- 26926 Colmenar
- 26952 Colmenar
- 26955 Colmenar
- 26951 Colmenar
- 26935 Colmenar
- 26941 Colmenar
- 26945 Colmenar
- 27372 Iris Ave
- 26931 Colmenar
- 27276 Miraflores
- 26922 Colmenar
- 27282 Miraflores
- 26925 Colmenar
- 27385 Iris Ave
- 27387 Iris Ave
- 26903 Orchid Ave
- 27284 Miraflores