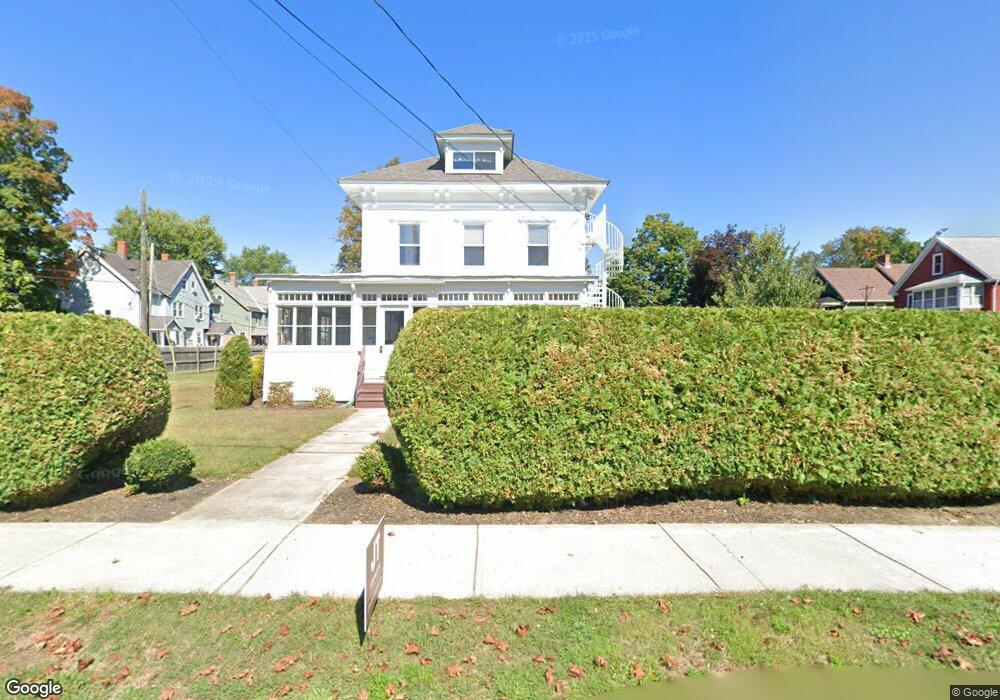
27 High St Easthampton, MA 01027
Estimated Value: $461,845 - $538,000
5
Beds
4
Baths
3,174
Sq Ft
$159/Sq Ft
Est. Value
About This Home
This home is located at 27 High St, Easthampton, MA 01027 and is currently estimated at $503,461, approximately $158 per square foot. 27 High St is a home located in Hampshire County with nearby schools including Easthampton High School, Hilltown Cooperative Charter Public School, and Calvary Baptist Christian School.
Ownership History
Date
Name
Owned For
Owner Type
Purchase Details
Closed on
Oct 21, 1994
Sold by
Vanguard Sb
Bought by
Fedor Martin
Current Estimated Value
Purchase Details
Closed on
Aug 15, 1988
Sold by
Lafontaine Robert M
Bought by
Harrington Ii John L
Home Financials for this Owner
Home Financials are based on the most recent Mortgage that was taken out on this home.
Original Mortgage
$156,000
Interest Rate
10.34%
Mortgage Type
Purchase Money Mortgage
Create a Home Valuation Report for This Property
The Home Valuation Report is an in-depth analysis detailing your home's value as well as a comparison with similar homes in the area
Home Values in the Area
Average Home Value in this Area
Purchase History
| Date | Buyer | Sale Price | Title Company |
|---|---|---|---|
| Fedor Martin | $71,000 | -- | |
| Harrington Ii John L | $195,000 | -- |
Source: Public Records
Mortgage History
| Date | Status | Borrower | Loan Amount |
|---|---|---|---|
| Previous Owner | Harrington Ii John L | $156,000 |
Source: Public Records
Tax History
| Year | Tax Paid | Tax Assessment Tax Assessment Total Assessment is a certain percentage of the fair market value that is determined by local assessors to be the total taxable value of land and additions on the property. | Land | Improvement |
|---|---|---|---|---|
| 2025 | $5,419 | $396,400 | $89,300 | $307,100 |
| 2024 | $5,429 | $400,400 | $101,600 | $298,800 |
| 2023 | $4,042 | $275,900 | $83,600 | $192,300 |
| 2022 | $4,561 | $275,900 | $83,600 | $192,300 |
| 2021 | $6,758 | $284,800 | $83,600 | $201,200 |
| 2020 | $6,663 | $275,900 | $83,600 | $192,300 |
| 2019 | $6,570 | $253,300 | $83,600 | $169,700 |
| 2018 | $3,861 | $241,300 | $79,900 | $161,400 |
| 2017 | $6,171 | $232,500 | $77,200 | $155,300 |
| 2016 | $3,625 | $232,500 | $77,200 | $155,300 |
| 2015 | $3,522 | $232,500 | $77,200 | $155,300 |
Source: Public Records
Map
Nearby Homes
- 7 Union Ct
- 3 Conrad Cir Unit 3
- 19 Nicols Way Unit 19
- 33 Knipfer Ave
- 11 Dragon Cir
- 26 Winter St
- 4 Gaugh St
- 40 Clark St
- 10-12 Oakdale Place
- 14 Dewey St
- 52-54 Holyoke St
- 29 Parsons St Unit 1
- 1 2nd Ave
- 6 Wilton Rd
- M143 &152 Glendale St
- 385 Main St
- 131 West St Unit 131
- 336 Main St
- 6 S St & Abutting Lots
- 2 W Park Dr
Your Personal Tour Guide
Ask me questions while you tour the home.