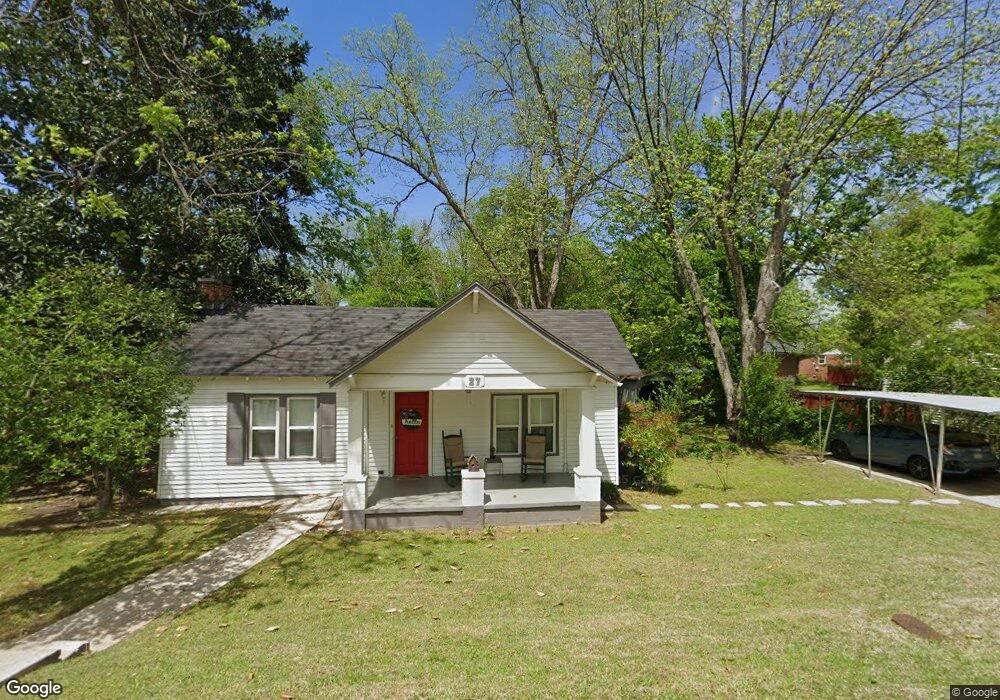
27 James St Hampton, GA 30228
Estimated Value: $136,000 - $203,000
2
Beds
1
Bath
1,015
Sq Ft
$163/Sq Ft
Est. Value
About This Home
This home is located at 27 James St, Hampton, GA 30228 and is currently estimated at $165,729, approximately $163 per square foot. 27 James St is a home located in Henry County with nearby schools including Rocky Creek Elementary School, Hampton Middle School, and Hampton High School.
Ownership History
Date
Name
Owned For
Owner Type
Purchase Details
Closed on
Feb 10, 2005
Sold by
Blankinship Johnnie A
Bought by
Tucker Jerry J
Current Estimated Value
Purchase Details
Closed on
Aug 7, 2002
Sold by
Jc Custom Homes Llc
Bought by
Blankenship Johnnie A
Home Financials for this Owner
Home Financials are based on the most recent Mortgage that was taken out on this home.
Original Mortgage
$50,172
Interest Rate
6.3%
Mortgage Type
New Conventional
Purchase Details
Closed on
Mar 2, 2001
Sold by
Askey Charlie E and Askey Phyllis R
Bought by
J C Custom Homes Llc
Home Financials for this Owner
Home Financials are based on the most recent Mortgage that was taken out on this home.
Original Mortgage
$49,900
Interest Rate
7.01%
Mortgage Type
New Conventional
Purchase Details
Closed on
Jun 3, 1993
Sold by
Watson Eloise E
Bought by
Askew Charlie E and Birchman Phyllis R
Create a Home Valuation Report for This Property
The Home Valuation Report is an in-depth analysis detailing your home's value as well as a comparison with similar homes in the area
Home Values in the Area
Average Home Value in this Area
Purchase History
| Date | Buyer | Sale Price | Title Company |
|---|---|---|---|
| Tucker Jerry J | $44,900 | -- | |
| Blankenship Johnnie A | $49,600 | -- | |
| J C Custom Homes Llc | $55,000 | -- | |
| Askew Charlie E | $25,000 | -- |
Source: Public Records
Mortgage History
| Date | Status | Borrower | Loan Amount |
|---|---|---|---|
| Previous Owner | Blankenship Johnnie A | $50,172 | |
| Previous Owner | J C Custom Homes Llc | $49,900 |
Source: Public Records
Tax History
| Year | Tax Paid | Tax Assessment Tax Assessment Total Assessment is a certain percentage of the fair market value that is determined by local assessors to be the total taxable value of land and additions on the property. | Land | Improvement |
|---|---|---|---|---|
| 2025 | $2,359 | $59,688 | $13,200 | $46,488 |
| 2024 | $2,359 | $58,240 | $13,200 | $45,040 |
| 2023 | $2,120 | $53,120 | $11,000 | $42,120 |
| 2022 | $1,653 | $40,680 | $11,000 | $29,680 |
| 2021 | $1,215 | $33,560 | $11,000 | $22,560 |
| 2020 | $1,120 | $30,920 | $11,000 | $19,920 |
| 2019 | $1,012 | $27,480 | $8,800 | $18,680 |
| 2018 | $879 | $24,040 | $8,800 | $15,240 |
| 2016 | $778 | $21,320 | $7,520 | $13,800 |
| 2015 | $621 | $16,440 | $7,520 | $8,920 |
| 2014 | $598 | $15,720 | $7,520 | $8,200 |
Source: Public Records
Map
Nearby Homes
- 13 Derrick St
- 32 Mcdonough St
- 21 Elm St
- 1903 Elm Park Dr
- 38 Mcdonough St
- 10 Plum Blossom Ln
- 28 Elm St
- 2025 Elm Grove Ln
- 16 Rosenwald Dr
- 42 Elm St
- 25 Georgia Ave
- 248 Fern Ct
- 2 AC Highway 20
- 55 Porter Cir
- 220 Windpher Ridge
- 120 Bridgemill Dr
- 120 Caldwell Dr
- 14803 Woolsey Rd
- 260 Sandstone Dr
- 1111 Watercourse Way
Your Personal Tour Guide
Ask me questions while you tour the home.