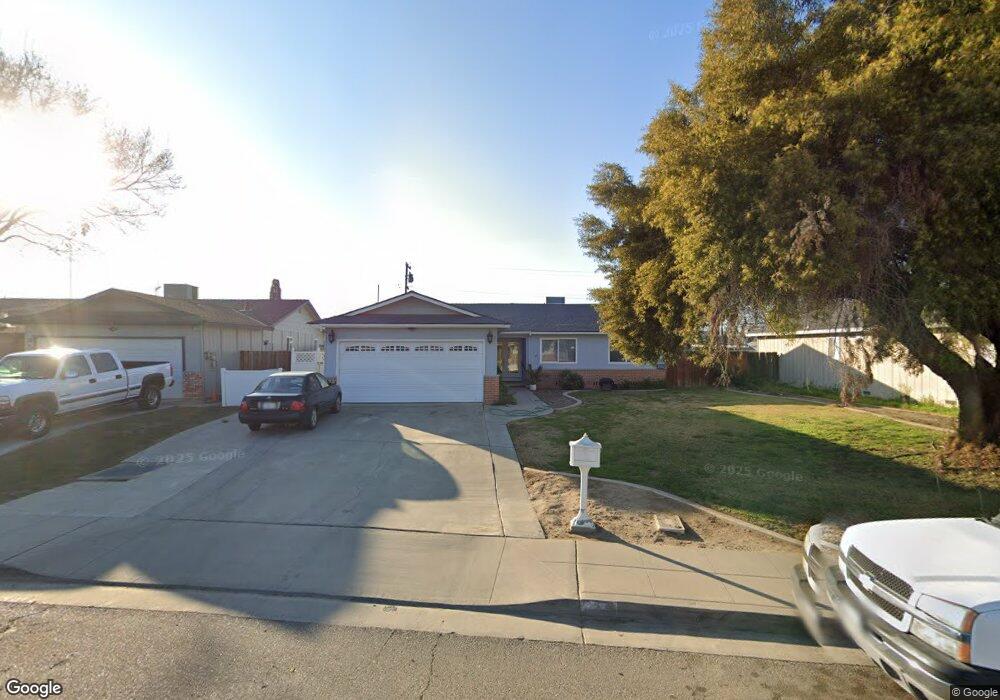
27 S Byron Dr Lemoore, CA 93245
Estimated Value: $321,723 - $327,000
3
Beds
2
Baths
1,456
Sq Ft
$223/Sq Ft
Est. Value
About This Home
This home is located at 27 S Byron Dr, Lemoore, CA 93245 and is currently estimated at $324,431, approximately $222 per square foot. 27 S Byron Dr is a home located in Kings County with nearby schools including Lemoore Elementary School, Liberty Middle School, and Lemoore High School.
Ownership History
Date
Name
Owned For
Owner Type
Purchase Details
Closed on
Dec 20, 2010
Sold by
The Bank Of New York Mellon
Bought by
Ramos Maria
Current Estimated Value
Home Financials for this Owner
Home Financials are based on the most recent Mortgage that was taken out on this home.
Original Mortgage
$133,206
Outstanding Balance
$90,349
Interest Rate
4.75%
Mortgage Type
FHA
Estimated Equity
$234,082
Purchase Details
Closed on
May 17, 2010
Sold by
Lopez Mary O and Lopez William E
Bought by
The Bank Of New York Mellon and The Bank Of New York
Purchase Details
Closed on
Dec 19, 1996
Sold by
Lowe Robert S and Lowe Sandra K
Bought by
Lopez William E and Lopez Mary O
Home Financials for this Owner
Home Financials are based on the most recent Mortgage that was taken out on this home.
Original Mortgage
$103,528
Interest Rate
7.66%
Mortgage Type
FHA
Create a Home Valuation Report for This Property
The Home Valuation Report is an in-depth analysis detailing your home's value as well as a comparison with similar homes in the area
Home Values in the Area
Average Home Value in this Area
Purchase History
| Date | Buyer | Sale Price | Title Company |
|---|---|---|---|
| Ramos Maria | $135,000 | Passion Title Services | |
| The Bank Of New York Mellon | $144,000 | First American Title Ins Co | |
| Lopez William E | $109,000 | Hanford Title Company |
Source: Public Records
Mortgage History
| Date | Status | Borrower | Loan Amount |
|---|---|---|---|
| Open | Ramos Maria | $133,206 | |
| Previous Owner | Lopez William E | $103,528 |
Source: Public Records
Tax History
| Year | Tax Paid | Tax Assessment Tax Assessment Total Assessment is a certain percentage of the fair market value that is determined by local assessors to be the total taxable value of land and additions on the property. | Land | Improvement |
|---|---|---|---|---|
| 2025 | $4,369 | $172,954 | $76,868 | $96,086 |
| 2023 | $4,369 | $166,239 | $73,884 | $92,355 |
| 2022 | $4,456 | $162,981 | $72,436 | $90,545 |
| 2021 | $4,410 | $159,786 | $71,016 | $88,770 |
| 2020 | $4,355 | $158,148 | $70,288 | $87,860 |
| 2019 | $3,015 | $155,047 | $68,910 | $86,137 |
| 2018 | $2,903 | $152,007 | $67,559 | $84,448 |
| 2017 | $1,668 | $149,026 | $66,234 | $82,792 |
| 2016 | $1,569 | $146,104 | $64,935 | $81,169 |
| 2015 | $1,563 | $143,910 | $63,960 | $79,950 |
| 2014 | $1,517 | $141,091 | $62,707 | $78,384 |
Source: Public Records
Map
Nearby Homes
Your Personal Tour Guide
Ask me questions while you tour the home.