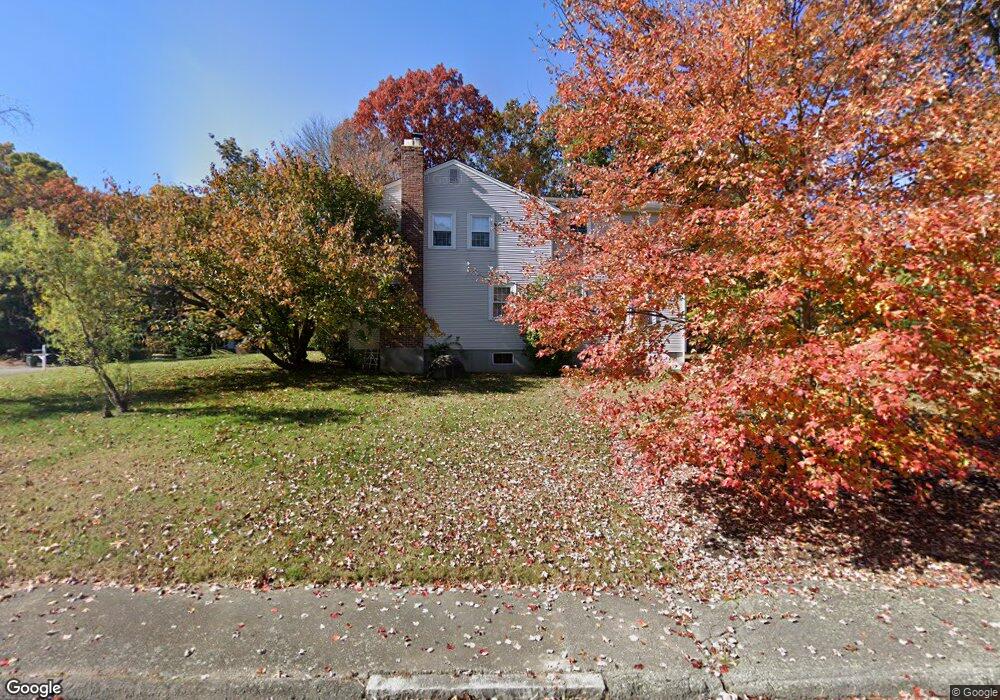
27 Shady Ln Franklin, MA 02038
Estimated Value: $809,339 - $917,000
5
Beds
4
Baths
2,776
Sq Ft
$307/Sq Ft
Est. Value
About This Home
This home is located at 27 Shady Ln, Franklin, MA 02038 and is currently estimated at $852,585, approximately $307 per square foot. 27 Shady Ln is a home located in Norfolk County with nearby schools including Helen Keller Elementary School, Annie Sullivan Middle School, and Franklin High School.
Ownership History
Date
Name
Owned For
Owner Type
Purchase Details
Closed on
Sep 6, 2023
Sold by
Young Ralph F and Young Kristen N
Bought by
Young Ft and Young
Current Estimated Value
Purchase Details
Closed on
Dec 6, 1996
Sold by
Paige Bradford C and Paige Jennifer C
Bought by
Young Ralph F and Young Kristen N
Home Financials for this Owner
Home Financials are based on the most recent Mortgage that was taken out on this home.
Original Mortgage
$175,465
Interest Rate
7.83%
Mortgage Type
Purchase Money Mortgage
Purchase Details
Closed on
Jul 15, 1994
Sold by
Lombardi Paul J and Lombardi Patricia M
Bought by
Paige Bradford C and Paige Jennifer C
Create a Home Valuation Report for This Property
The Home Valuation Report is an in-depth analysis detailing your home's value as well as a comparison with similar homes in the area
Home Values in the Area
Average Home Value in this Area
Purchase History
| Date | Buyer | Sale Price | Title Company |
|---|---|---|---|
| Young Ft | -- | None Available | |
| Young Ralph F | $184,700 | -- | |
| Paige Bradford C | $160,000 | -- |
Source: Public Records
Mortgage History
| Date | Status | Borrower | Loan Amount |
|---|---|---|---|
| Previous Owner | Paige Bradford C | $336,900 | |
| Previous Owner | Paige Bradford C | $43,000 | |
| Previous Owner | Paige Bradford C | $174,800 | |
| Previous Owner | Paige Bradford C | $175,465 |
Source: Public Records
Tax History Compared to Growth
Tax History
| Year | Tax Paid | Tax Assessment Tax Assessment Total Assessment is a certain percentage of the fair market value that is determined by local assessors to be the total taxable value of land and additions on the property. | Land | Improvement |
|---|---|---|---|---|
| 2025 | $8,235 | $708,700 | $328,700 | $380,000 |
| 2024 | $8,191 | $694,700 | $328,700 | $366,000 |
| 2023 | $7,909 | $628,700 | $280,100 | $348,600 |
| 2022 | $7,397 | $526,500 | $220,600 | $305,900 |
| 2021 | $7,202 | $491,600 | $247,700 | $243,900 |
| 2020 | $6,804 | $468,900 | $237,500 | $231,400 |
| 2019 | $6,726 | $458,800 | $227,400 | $231,400 |
| 2018 | $6,234 | $425,500 | $219,200 | $206,300 |
| 2017 | $5,968 | $409,300 | $203,000 | $206,300 |
| 2016 | $5,772 | $398,100 | $217,900 | $180,200 |
| 2015 | $5,746 | $387,200 | $207,000 | $180,200 |
| 2014 | $5,228 | $361,800 | $181,600 | $180,200 |
Source: Public Records
Map
Nearby Homes
- 204 Lincoln St
- 324 Pleasant St
- 266 Pleasant St
- 48 Pinehurst St
- 17 Longhill Rd
- 2 Kayla Dr
- 70 Daniels St
- 37 Daniels St
- 33 Daniels St
- 336 Maple St
- 41 Kimberlee Ave
- 14 Pleasant St Unit A
- 0 Upper Union St Unit 73230551
- 76 Dean Ave
- 91 Oliver Pond Cir Unit 3
- 83 Oliver Pond Cir Unit 7
- 48 Leanne Way Unit 48
- 67 Milliken Ave Unit 22
- 120 Union St Unit 1
- 31 Highwood Dr