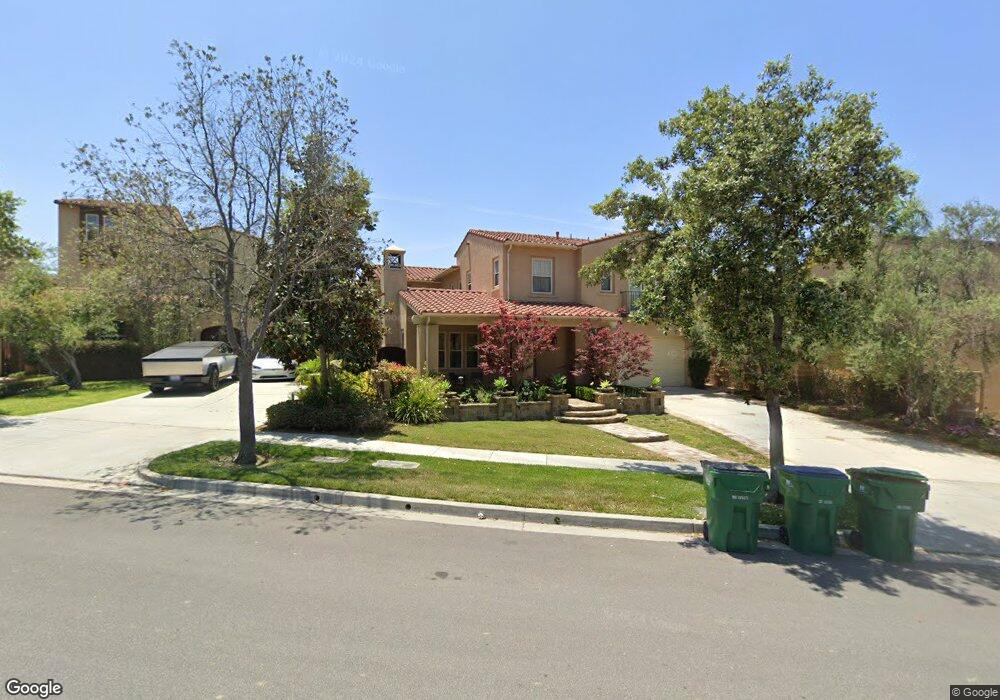
27 Small Grove Irvine, CA 92618
Portola Springs NeighborhoodEstimated Value: $3,064,476 - $3,905,000
6
Beds
5
Baths
3,945
Sq Ft
$901/Sq Ft
Est. Value
About This Home
This home is located at 27 Small Grove, Irvine, CA 92618 and is currently estimated at $3,556,369, approximately $901 per square foot. 27 Small Grove is a home located in Orange County with nearby schools including Portola Springs Elementary, Jeffrey Trail Middle, and Portola High School.
Ownership History
Date
Name
Owned For
Owner Type
Purchase Details
Closed on
Apr 6, 2016
Sold by
Khan Umar S
Bought by
Khan Umar S and The Us Khan Family Trust
Current Estimated Value
Purchase Details
Closed on
Aug 26, 2009
Sold by
Standard Pacific Corp
Bought by
Khan Umar S
Home Financials for this Owner
Home Financials are based on the most recent Mortgage that was taken out on this home.
Original Mortgage
$729,000
Outstanding Balance
$477,005
Interest Rate
5.2%
Mortgage Type
New Conventional
Estimated Equity
$3,079,364
Purchase Details
Closed on
Aug 12, 2009
Sold by
Irvine Community Development Company Llc
Bought by
Standard Pacific Corp
Home Financials for this Owner
Home Financials are based on the most recent Mortgage that was taken out on this home.
Original Mortgage
$729,000
Outstanding Balance
$477,005
Interest Rate
5.2%
Mortgage Type
New Conventional
Estimated Equity
$3,079,364
Purchase Details
Closed on
Apr 7, 2009
Sold by
Khan Gul Shabana U
Bought by
Khan Umar S
Create a Home Valuation Report for This Property
The Home Valuation Report is an in-depth analysis detailing your home's value as well as a comparison with similar homes in the area
Home Values in the Area
Average Home Value in this Area
Purchase History
| Date | Buyer | Sale Price | Title Company |
|---|---|---|---|
| Khan Umar S | -- | None Available | |
| Khan Umar S | $1,355,500 | First American Title Nhs | |
| Standard Pacific Corp | -- | First American Title Company | |
| Khan Umar S | -- | First American Title Nhs |
Source: Public Records
Mortgage History
| Date | Status | Borrower | Loan Amount |
|---|---|---|---|
| Open | Khan Umar S | $729,000 | |
| Closed | Standard Pacific Corp | $0 |
Source: Public Records
Tax History
| Year | Tax Paid | Tax Assessment Tax Assessment Total Assessment is a certain percentage of the fair market value that is determined by local assessors to be the total taxable value of land and additions on the property. | Land | Improvement |
|---|---|---|---|---|
| 2025 | $22,294 | $1,749,575 | $845,062 | $904,513 |
| 2024 | $22,294 | $1,715,270 | $828,492 | $886,778 |
| 2023 | $22,728 | $1,681,638 | $812,247 | $869,391 |
| 2022 | $22,283 | $1,648,665 | $796,320 | $852,345 |
| 2021 | $21,970 | $1,616,339 | $780,706 | $835,633 |
| 2020 | $21,794 | $1,599,766 | $772,701 | $827,065 |
| 2019 | $21,946 | $1,568,399 | $757,550 | $810,849 |
| 2018 | $21,930 | $1,537,647 | $742,697 | $794,950 |
| 2017 | $21,578 | $1,507,498 | $728,135 | $779,363 |
| 2016 | $21,184 | $1,477,940 | $713,858 | $764,082 |
| 2015 | $20,960 | $1,455,740 | $703,135 | $752,605 |
| 2014 | $20,669 | $1,427,225 | $689,362 | $737,863 |
Source: Public Records
Map
Nearby Homes
Your Personal Tour Guide
Ask me questions while you tour the home.