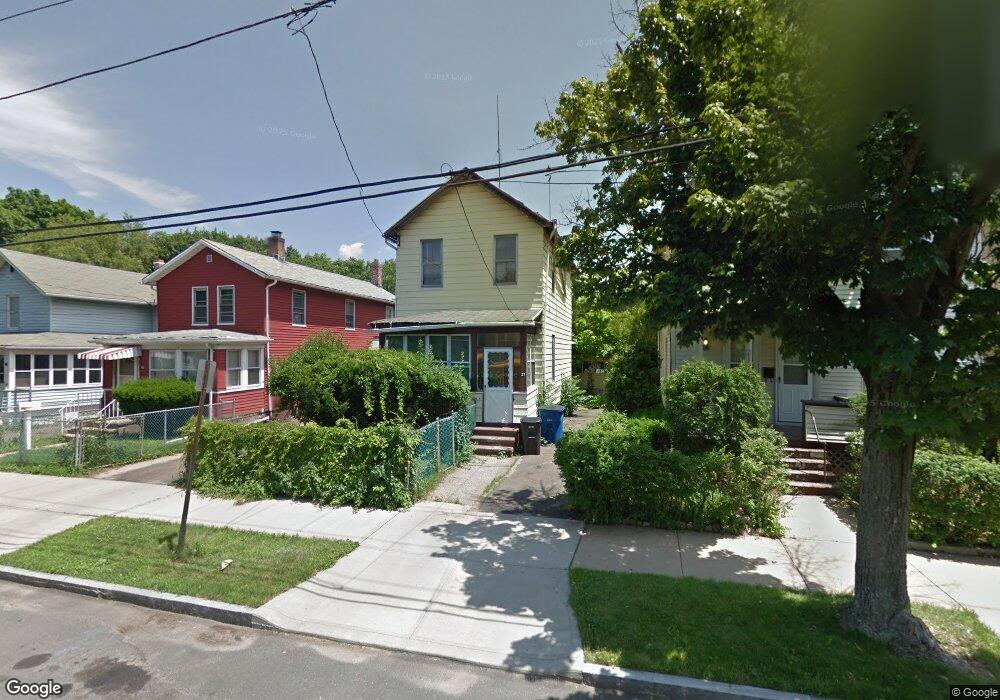
27 Watson St New Haven, CT 06511
Newhallville NeighborhoodEstimated Value: $203,000 - $255,000
2
Beds
1
Bath
952
Sq Ft
$239/Sq Ft
Est. Value
About This Home
This home is located at 27 Watson St, New Haven, CT 06511 and is currently estimated at $227,440, approximately $238 per square foot. 27 Watson St is a home located in New Haven County with nearby schools including Highville Charter School, The Foote School, and Cedarhurst School.
Ownership History
Date
Name
Owned For
Owner Type
Purchase Details
Closed on
Jun 23, 2025
Sold by
Sedeno Maria I
Bought by
Sedeno Maria I and Toledo Randy V
Current Estimated Value
Purchase Details
Closed on
May 17, 2019
Sold by
Desmond Melissa and New Haven City Of
Bought by
Toledo-Sedeno Maria I
Purchase Details
Closed on
Mar 29, 2019
Sold by
New Haven City Of
Bought by
Toledo-Sedeno Maria I
Create a Home Valuation Report for This Property
The Home Valuation Report is an in-depth analysis detailing your home's value as well as a comparison with similar homes in the area
Home Values in the Area
Average Home Value in this Area
Purchase History
| Date | Buyer | Sale Price | Title Company |
|---|---|---|---|
| Sedeno Maria I | -- | -- | |
| Sedeno Maria I | -- | -- | |
| Toledo-Sedeno Maria I | $47,000 | -- | |
| Toledo-Sedeno Maria I | $47,000 | -- | |
| Toledo-Sedeno Maria I | $47,100 | -- | |
| Toledo-Sedeno Maria I | $47,100 | -- |
Source: Public Records
Tax History
| Year | Tax Paid | Tax Assessment Tax Assessment Total Assessment is a certain percentage of the fair market value that is determined by local assessors to be the total taxable value of land and additions on the property. | Land | Improvement |
|---|---|---|---|---|
| 2025 | $3,643 | $92,470 | $25,200 | $67,270 |
| 2024 | $3,560 | $92,470 | $25,200 | $67,270 |
| 2023 | $3,440 | $92,470 | $25,200 | $67,270 |
| 2022 | $3,676 | $92,470 | $25,200 | $67,270 |
| 2021 | $2,291 | $52,220 | $20,160 | $32,060 |
| 2020 | $2,291 | $52,220 | $20,160 | $32,060 |
| 2019 | $2,244 | $52,220 | $20,160 | $32,060 |
| 2018 | $2,244 | $52,220 | $20,160 | $32,060 |
| 2017 | $2,020 | $52,220 | $20,160 | $32,060 |
| 2016 | $1,957 | $47,110 | $10,360 | $36,750 |
| 2015 | $1,957 | $47,110 | $10,360 | $36,750 |
| 2014 | $1,957 | $47,110 | $10,360 | $36,750 |
Source: Public Records
Map
Nearby Homes
- 24 Watson St
- 407 Shelton Ave
- 773 Dixwell Ave
- 48 Alling St
- 201 Ivy St
- 238 Newhall St
- 26 Lander St
- 251 Starr St
- 254 Starr St
- 780 Winchester Ave
- 118 Cherry Ann St
- 293 Division St
- 622 Winchester Ave
- 1002 Winchester Ave
- 171 Morse St
- 40 Harding Place
- 126 Sheffield Ave
- 59 Pine St
- 449 Dixwell Ave
- 131 Bryden Terrace
Your Personal Tour Guide
Ask me questions while you tour the home.