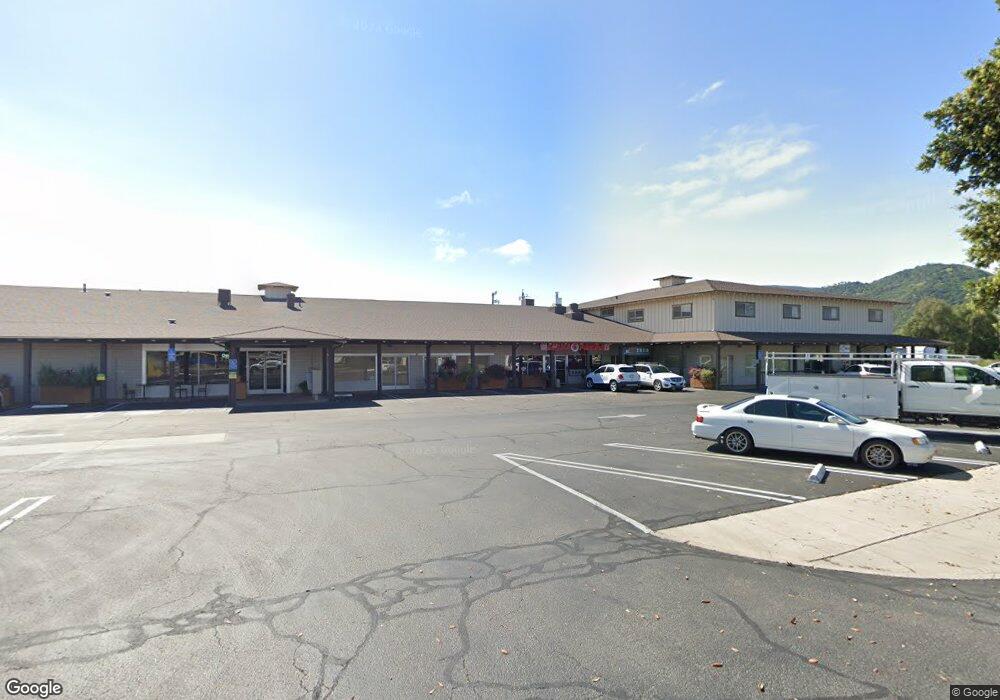
270 E Highway 246 Unit 209 Buellton, CA 93427
Studio
--
Bath
--
Sq Ft
126,760
Sq Ft
About This Home
This home is located at 270 E Highway 246 Unit 209, Buellton, CA 93427. 270 E Highway 246 Unit 209 is a home located in Santa Barbara County with nearby schools including Oak Valley Elementary School, Jonata Middle School, and Santa Ynez Valley Union High School.
Ownership History
Date
Name
Owned For
Owner Type
Purchase Details
Closed on
Dec 27, 2012
Sold by
Nielsens Market
Bought by
Nielsen Holdings
Purchase Details
Closed on
Jun 1, 2006
Sold by
Nielsen Roger A and Nielsen Anlaug M
Bought by
Nielsen Roger A and Nielsen Anlaug M
Purchase Details
Closed on
Sep 16, 1998
Sold by
Nielsens Market Inc
Bought by
Nielsen Roger A and Nielsen Anlaug M
Home Financials for this Owner
Home Financials are based on the most recent Mortgage that was taken out on this home.
Original Mortgage
$1,440,000
Interest Rate
6.88%
Mortgage Type
Commercial
Purchase Details
Closed on
Sep 14, 1998
Sold by
Buellton Shopping Center
Bought by
Nielsens Market Inc
Home Financials for this Owner
Home Financials are based on the most recent Mortgage that was taken out on this home.
Original Mortgage
$1,440,000
Interest Rate
6.88%
Mortgage Type
Commercial
Create a Home Valuation Report for This Property
The Home Valuation Report is an in-depth analysis detailing your home's value as well as a comparison with similar homes in the area
Home Values in the Area
Average Home Value in this Area
Purchase History
| Date | Buyer | Sale Price | Title Company |
|---|---|---|---|
| Nielsen Holdings | -- | None Available | |
| Nielsen Roger A | -- | None Available | |
| Nielsen Roger A | $1,439,000 | Chicago Title Co | |
| Nielsens Market Inc | -- | Chicago Title | |
| Buellton Shopping Center | -- | Chicago Title |
Source: Public Records
Mortgage History
| Date | Status | Borrower | Loan Amount |
|---|---|---|---|
| Previous Owner | Nielsen Roger A | $1,440,000 | |
| Previous Owner | Nielsens Market Inc | $1,440,000 |
Source: Public Records
Tax History
| Year | Tax Paid | Tax Assessment Tax Assessment Total Assessment is a certain percentage of the fair market value that is determined by local assessors to be the total taxable value of land and additions on the property. | Land | Improvement |
|---|---|---|---|---|
| 2025 | $30,768 | $2,887,873 | $1,199,097 | $1,688,776 |
| 2023 | $30,768 | $2,761,030 | $1,152,536 | $1,608,494 |
| 2022 | $29,607 | $2,706,893 | $1,129,938 | $1,576,955 |
| 2021 | $29,112 | $2,653,818 | $1,107,783 | $1,546,035 |
| 2020 | $28,761 | $2,626,608 | $1,096,425 | $1,530,183 |
| 2019 | $28,259 | $2,575,107 | $1,074,927 | $1,500,180 |
| 2018 | $27,759 | $2,524,615 | $1,053,850 | $1,470,765 |
| 2017 | $27,280 | $2,475,114 | $1,033,187 | $1,441,927 |
| 2016 | $26,252 | $2,426,583 | $1,012,929 | $1,413,654 |
| 2015 | $25,919 | $2,390,134 | $997,714 | $1,392,420 |
| 2014 | $25,443 | $2,343,316 | $978,171 | $1,365,145 |
Source: Public Records
Map
Nearby Homes
- 348 Kendale Rd
- 536 Elkton Ln
- 546 Covelo Ln
- 456 Dove Canyon Rd
- 91 Six Flags Cir
- 201 Victory Dr Unit 3
- 593 Avenue of Flags
- 801 E Highway 246
- 593 Central Ave
- 80 Zaca St Unit Spc 15
- 80 Zaca St Unit 26
- 330 W Highway 246 Unit 51
- 330 W Highway 246 Unit Spc 14
- 330 W Highway 246 Unit Spc 50
- 330 W Highway 246 Unit 17
- 1701 W Highway 246
- 110 Commerce Dr
- 330 W Highway 246 Unit 225
- 330 W Hwy 246 Unit 225
- 330 W Hwy 246 Unit 83
- 270 E Highway 246
- 270 E Hwy 246
- 270 E Hwy 246 Unit 105
- 270 E Hwy 246 Unit 104
- 270 E Hwy 246 Unit 209
- 270 E Highway 246 Unit 212
- 270 E Highway 246 Unit 111
- 270 E Highway 246 Unit 104
- 270 E Highway 246 Unit 104/105
- 252 E Highway 246 Unit B
- 252 E Highway 246
- 254 E Highway 246 Unit B
- 290 E Hwy 246
- 290 E Highway 246
- 290 E 246 Hwy
- 240 E Highway 246 Unit 105
- 240 E Highway 246 Unit 103B
- 240 E Highway 246 Unit 107
- 240 E Highway 246 Unit 101
- 240 E Highway 246 Unit 104
Your Personal Tour Guide
Ask me questions while you tour the home.