Estimated Value: $497,817 - $514,000
2
Beds
3
Baths
1,536
Sq Ft
$330/Sq Ft
Est. Value
About This Home
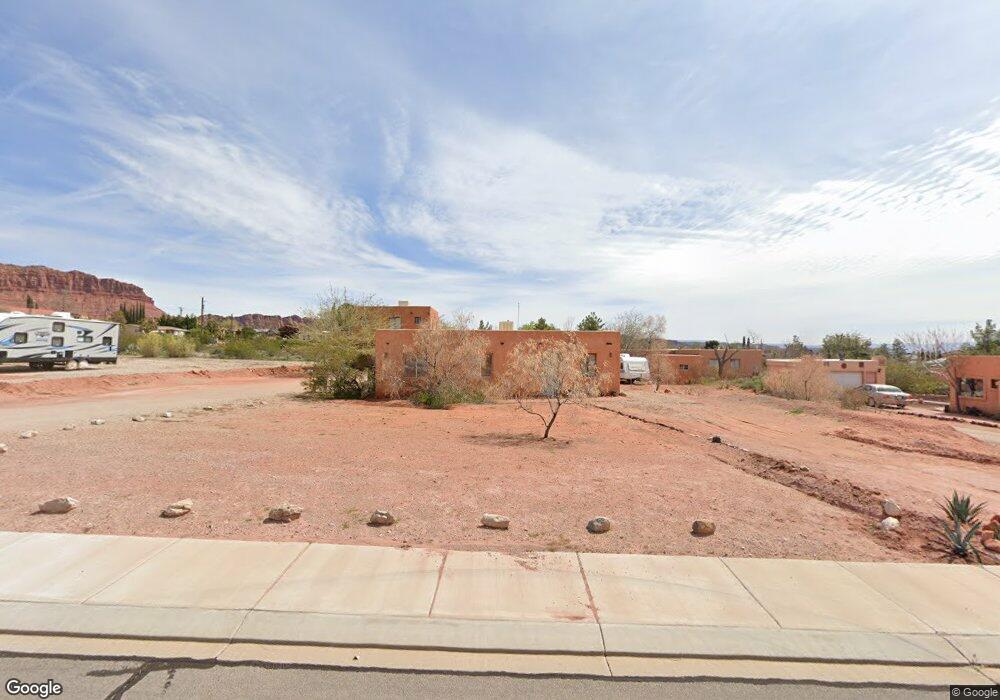
This home is located at 270 N Main St, Ivins, UT 84738 and is currently estimated at $506,204, approximately $329 per square foot. 270 N Main St is a home located in Washington County with nearby schools including Red Mountain School, Snow Canyon Middle School, and Lava Ridge Intermediate School.
Ownership History
Date
Name
Owned For
Owner Type
Purchase Details
Closed on
Dec 1, 2025
Sold by
Milecki Adam and Milecki Diane Michelle
Bought by
Milecki Irrevocable Trust and Milecki
Current Estimated Value
Purchase Details
Closed on
Dec 18, 2020
Sold by
Milecki Adam Paul and Milecki Diane Michelle
Bought by
Millecki Adam and Millecki Diane Michelle
Home Financials for this Owner
Home Financials are based on the most recent Mortgage that was taken out on this home.
Original Mortgage
$268,500
Interest Rate
2.8%
Mortgage Type
New Conventional
Purchase Details
Closed on
Jun 19, 2013
Sold by
Bearnson Timothy C
Bought by
Milecki Adam Paul and Milecki Diane Michelle
Home Financials for this Owner
Home Financials are based on the most recent Mortgage that was taken out on this home.
Original Mortgage
$124,000
Interest Rate
3.38%
Mortgage Type
New Conventional
Create a Home Valuation Report for This Property
The Home Valuation Report is an in-depth analysis detailing your home's value as well as a comparison with similar homes in the area
Purchase History
| Date | Buyer | Sale Price | Title Company |
|---|---|---|---|
| Milecki Irrevocable Trust | -- | None Listed On Document | |
| Millecki Adam | -- | North Amer Ttl Ut Union Park | |
| Milecki Adam Paul | -- | Southern Utah Title |
Source: Public Records
Mortgage History
| Date | Status | Borrower | Loan Amount |
|---|---|---|---|
| Previous Owner | Millecki Adam | $268,500 | |
| Previous Owner | Milecki Adam Paul | $124,000 |
Source: Public Records
Tax History
| Year | Tax Paid | Tax Assessment Tax Assessment Total Assessment is a certain percentage of the fair market value that is determined by local assessors to be the total taxable value of land and additions on the property. | Land | Improvement |
|---|---|---|---|---|
| 2025 | $1,925 | $271,590 | $66,000 | $205,590 |
| 2023 | $1,800 | $263,835 | $66,000 | $197,835 |
| 2022 | $1,942 | $267,850 | $66,000 | $201,850 |
| 2021 | $1,676 | $343,500 | $80,000 | $263,500 |
| 2020 | $1,615 | $313,200 | $70,000 | $243,200 |
| 2019 | $1,538 | $291,700 | $55,000 | $236,700 |
| 2018 | $1,353 | $128,480 | $0 | $0 |
| 2017 | $1,239 | $117,645 | $0 | $0 |
| 2016 | $1,258 | $110,330 | $0 | $0 |
| 2015 | $1,274 | $107,580 | $0 | $0 |
| 2014 | $1,127 | $95,645 | $0 | $0 |
Source: Public Records
Map
Nearby Homes
- 310 N Main St
- 155 E 200 N
- 165 E 350 N
- 266 E 350 N
- 1312 Willow Way 1 Unit 1
- 543 W Fox Tail Way
- 143 N Apex Ln
- 88 N Apex Ln
- 328 N Harrier Ln
- 185 W Center St
- 340 W Tonalli
- 278 N Falcon Ct
- 378 Redstone Ct
- 143 N Cortez Trail
- 257 W Peaceful Ln
- 469 N Bur Sage Trail
- 373 W Meridian Dr
- TBD N Agave Way
- 262 W 200 S
- 446 W Ithica Dr
Your Personal Tour Guide
Ask me questions while you tour the home.