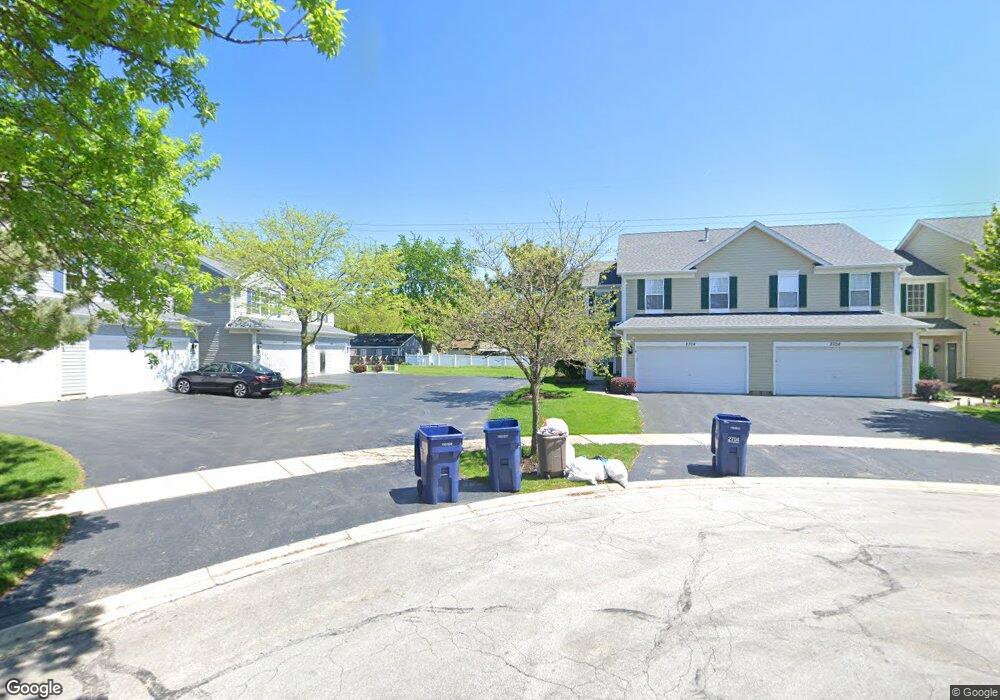
2704 Mcclennan Ct Unit 271001 Naperville, IL 60563
Brookdale NeighborhoodEstimated Value: $330,000 - $371,190
3
Beds
2
Baths
1,646
Sq Ft
$213/Sq Ft
Est. Value
About This Home
This home is located at 2704 Mcclennan Ct Unit 271001, Naperville, IL 60563 and is currently estimated at $351,298, approximately $213 per square foot. 2704 Mcclennan Ct Unit 271001 is a home located in DuPage County with nearby schools including Brookdale Elementary School, Thayer J. Hill Middle School, and Metea Valley High School.
Ownership History
Date
Name
Owned For
Owner Type
Purchase Details
Closed on
Nov 14, 2002
Sold by
Reitzel David A and Reitzel Abbie S
Bought by
Fahey Jeffery J
Current Estimated Value
Home Financials for this Owner
Home Financials are based on the most recent Mortgage that was taken out on this home.
Original Mortgage
$146,400
Outstanding Balance
$61,591
Interest Rate
6.08%
Estimated Equity
$289,707
Purchase Details
Closed on
Dec 21, 1998
Sold by
St Paul Trust Company
Bought by
Reitzel David A and Reitzel Abbie S
Home Financials for this Owner
Home Financials are based on the most recent Mortgage that was taken out on this home.
Original Mortgage
$131,600
Interest Rate
6.25%
Create a Home Valuation Report for This Property
The Home Valuation Report is an in-depth analysis detailing your home's value as well as a comparison with similar homes in the area
Home Values in the Area
Average Home Value in this Area
Purchase History
| Date | Buyer | Sale Price | Title Company |
|---|---|---|---|
| Fahey Jeffery J | $183,000 | First American Title | |
| Reitzel David A | $165,000 | -- |
Source: Public Records
Mortgage History
| Date | Status | Borrower | Loan Amount |
|---|---|---|---|
| Open | Fahey Jeffery J | $146,400 | |
| Previous Owner | Reitzel David A | $131,600 | |
| Closed | Reitzel David A | $16,450 |
Source: Public Records
Tax History Compared to Growth
Tax History
| Year | Tax Paid | Tax Assessment Tax Assessment Total Assessment is a certain percentage of the fair market value that is determined by local assessors to be the total taxable value of land and additions on the property. | Land | Improvement |
|---|---|---|---|---|
| 2024 | $5,703 | $99,360 | $19,042 | $80,318 |
| 2023 | $5,435 | $89,280 | $17,110 | $72,170 |
| 2022 | $5,229 | $82,520 | $15,810 | $66,710 |
| 2021 | $5,058 | $79,580 | $15,250 | $64,330 |
| 2020 | $5,051 | $79,580 | $15,250 | $64,330 |
| 2019 | $4,841 | $75,680 | $14,500 | $61,180 |
| 2018 | $4,588 | $70,820 | $13,570 | $57,250 |
| 2017 | $4,455 | $68,420 | $13,110 | $55,310 |
| 2016 | $4,364 | $65,660 | $12,580 | $53,080 |
| 2015 | $4,311 | $62,340 | $11,940 | $50,400 |
| 2013 | $4,256 | $60,210 | $11,530 | $48,680 |
Source: Public Records
Map
Nearby Homes
- 2755 Sheridan Ct Unit 270102
- 893 Nelli Ct Unit 101
- 2824 Collins Ct Unit 210205
- 2813 Bond Cir
- 1981 Golden Gate Ln Unit 341801
- 5S510 Scots Dr Unit G
- 1912 Oxley Cir Unit 13106
- 1022 Neudearborn Ln Unit 19-1022
- 2015 Yellow Daisy Ct
- 1517 London Ct
- 1911 Continental Ave
- 1628 Westminster Dr
- 5S100 Pebblewood Ln Unit E4
- 1329 Queensgreen Cir Unit 1301
- 30W355 Claymore Ln
- 1332 Mc Dowell Rd Unit 104
- 1561 Raymond Dr Unit 104
- 2357 Overlook Ct
- 1444 Bayou Path Dr
- 835 Genesee Dr
- 2708 Mcclennan Ct Unit 271002
- 2712 Mcclennan Ct Unit 271003
- 2716 Mcclennan Ct Unit 271004
- 2703 Mcclennan Ct
- 2707 Mcclennan Ct Unit 27903
- 2715 Mcclennan Ct Unit 270901
- 2723 Mcclennan Ct Unit 270804
- 2724 Mcclennan Ct Unit 271101
- 1840 Paddington Ave
- 2727 Mcclennan Ct Unit 270803
- 2727 Mcclennan Ct
- 2727 Mcclennan Ct
- 1836 Paddington Ave
- 1844 Paddington Ave
- 2731 Mcclennan Ct Unit 270802
- 2728 Mcclennan Ct Unit 271102
- 2716 Sheridan Ct Unit 270404
- 1848 Paddington Ave
- 1832 Paddington Ave
- 2735 Mcclennan Ct Unit 270801