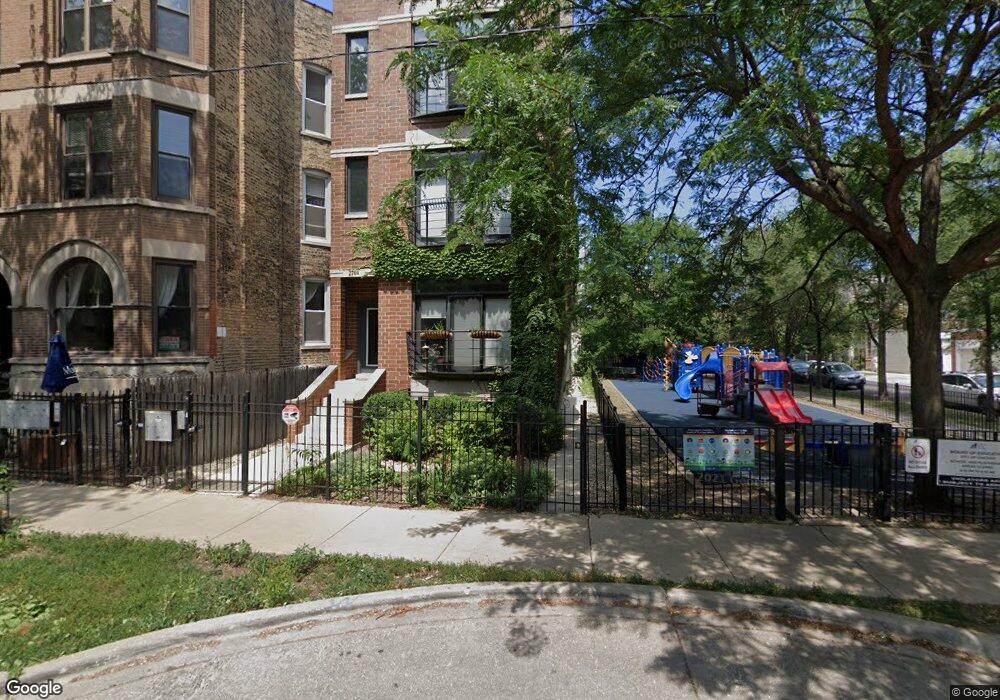
2704 W Cortez St Unit P2 Chicago, IL 60622
Humboldt Park NeighborhoodEstimated Value: $498,000
--
Bed
--
Bath
4,982
Sq Ft
$100/Sq Ft
Est. Value
About This Home
This home is located at 2704 W Cortez St Unit P2, Chicago, IL 60622 and is currently estimated at $498,000, approximately $99 per square foot. 2704 W Cortez St Unit P2 is a home located in Cook County with nearby schools including Chopin Elementary School, Clemente Community Academy High School, and Acero - Esmera Santiago Elementary School.
Ownership History
Date
Name
Owned For
Owner Type
Purchase Details
Closed on
Jun 28, 2018
Sold by
Wesley Timothy John and Wesley Bridget C
Bought by
Donnell Brendan O and Farnik Tamara
Current Estimated Value
Home Financials for this Owner
Home Financials are based on the most recent Mortgage that was taken out on this home.
Original Mortgage
$335,620
Outstanding Balance
$290,019
Interest Rate
4.37%
Mortgage Type
New Conventional
Estimated Equity
$207,981
Purchase Details
Closed on
Mar 24, 2008
Sold by
Wesley Timothy John and Wesley Bridget C
Bought by
Wesley Timothy John and Wesley Bridget C
Home Financials for this Owner
Home Financials are based on the most recent Mortgage that was taken out on this home.
Original Mortgage
$288,000
Interest Rate
6.1%
Mortgage Type
New Conventional
Create a Home Valuation Report for This Property
The Home Valuation Report is an in-depth analysis detailing your home's value as well as a comparison with similar homes in the area
Home Values in the Area
Average Home Value in this Area
Purchase History
| Date | Buyer | Sale Price | Title Company |
|---|---|---|---|
| Donnell Brendan O | $346,000 | First American Title | |
| Wesley Timothy John | -- | Lakeshore Title Agency |
Source: Public Records
Mortgage History
| Date | Status | Borrower | Loan Amount |
|---|---|---|---|
| Open | Donnell Brendan O | $335,620 | |
| Previous Owner | Wesley Timothy John | $288,000 |
Source: Public Records
Tax History Compared to Growth
Tax History
| Year | Tax Paid | Tax Assessment Tax Assessment Total Assessment is a certain percentage of the fair market value that is determined by local assessors to be the total taxable value of land and additions on the property. | Land | Improvement |
|---|---|---|---|---|
| 2024 | $393 | $2,812 | $401 | $2,411 |
| 2023 | $382 | $1,861 | $183 | $1,678 |
| 2022 | $382 | $1,861 | $183 | $1,678 |
| 2021 | $374 | $1,859 | $182 | $1,677 |
| 2020 | $550 | $2,469 | $182 | $2,287 |
| 2019 | $549 | $2,732 | $182 | $2,550 |
| 2018 | $576 | $2,916 | $182 | $2,734 |
| 2017 | $456 | $2,119 | $161 | $1,958 |
| 2016 | $424 | $2,119 | $161 | $1,958 |
| 2015 | $388 | $2,119 | $161 | $1,958 |
| 2014 | $397 | $2,140 | $145 | $1,995 |
| 2013 | $389 | $2,140 | $145 | $1,995 |
Source: Public Records
Map
Nearby Homes
- 2714 W Cortez St Unit 1
- 2647 W Cortez St
- 2708 W Thomas St Unit 2
- 1045 N California Ave
- 2651 W Augusta Blvd Unit 3
- 2651 W Augusta Blvd Unit 1
- 2651 W Haddon Ave Unit 1
- 938 N Washtenaw Ave
- 1046 N Rockwell St
- 942 N Fairfield Ave Unit 2W
- 936 N Fairfield Ave
- 929 N Fairfield Ave
- 2634 W Haddon Ave
- 1118 N California Ave
- 2601 W Haddon Ave Unit 2E
- 948 N California Ave
- 2554 W Augusta Blvd
- 1113 N Mozart St Unit 1
- 1129 N Mozart St Unit 1
- 1002 N Mozart St
- 2704 W Cortez St Unit P3
- 2704 W Cortez St Unit P1
- 2704 W Cortez St Unit 3
- 2704 W Cortez St Unit 2
- 2706 W Cortez St Unit 1N
- 2706 W Cortez St Unit 3S
- 2706 W Cortez St Unit GS
- 2706 W Cortez St Unit 1S
- 2706 W Cortez St Unit 3N
- 2706 W Cortez St Unit 2N
- 2706 W Cortez St Unit 2S
- 2706 W Cortez St Unit 3R
- 2706 W Cortez St Unit 2R
- 2706 W Cortez St Unit 1R
- 2706 W Cortez St Unit 2
- 2706 W Cortez St Unit 3
- 2706 W Cortez St Unit 1G
- 2710 W Cortez St Unit 3
- 2710 W Cortez St Unit 2710 West Cortez St.
- 2710 W Cortez St Unit 2