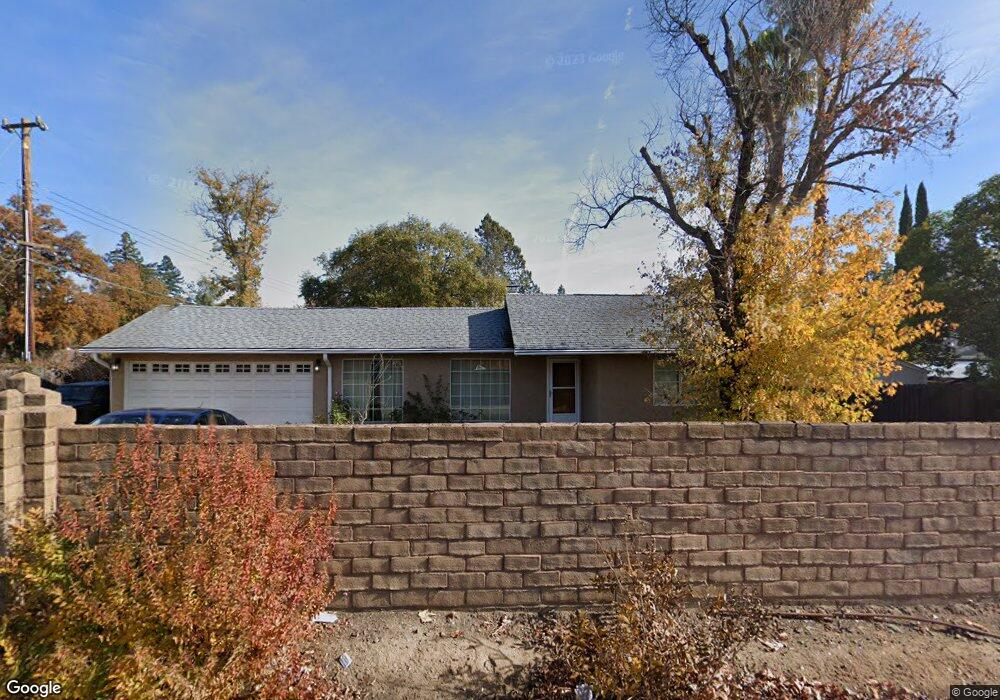
2710 Walnut Ave Carmichael, CA 95608
Carmichael Town Center NeighborhoodEstimated Value: $432,000 - $519,000
3
Beds
2
Baths
1,557
Sq Ft
$312/Sq Ft
Est. Value
About This Home
This home is located at 2710 Walnut Ave, Carmichael, CA 95608 and is currently estimated at $485,183, approximately $311 per square foot. 2710 Walnut Ave is a home located in Sacramento County with nearby schools including Starr King K-8, Rio Americano High School, and Visions In Education School.
Ownership History
Date
Name
Owned For
Owner Type
Purchase Details
Closed on
Mar 22, 2021
Sold by
Schulte Lorri K and Schulte David D
Bought by
Schulte David D and Schulte Lorri K
Current Estimated Value
Purchase Details
Closed on
Aug 13, 2001
Sold by
Beltram Trnia
Bought by
Schulte David D and Schulte Lorri K
Home Financials for this Owner
Home Financials are based on the most recent Mortgage that was taken out on this home.
Original Mortgage
$156,000
Outstanding Balance
$61,117
Interest Rate
7.21%
Estimated Equity
$424,066
Purchase Details
Closed on
Nov 28, 1994
Sold by
Gage Scott
Bought by
Beltram Trina
Purchase Details
Closed on
Jun 14, 1994
Sold by
Citizens Federal Bank
Bought by
Beltram Trina
Home Financials for this Owner
Home Financials are based on the most recent Mortgage that was taken out on this home.
Original Mortgage
$72,000
Interest Rate
5.75%
Purchase Details
Closed on
Mar 18, 1994
Sold by
Multistate Document Processing Corp
Bought by
Citizens Federal Bank
Create a Home Valuation Report for This Property
The Home Valuation Report is an in-depth analysis detailing your home's value as well as a comparison with similar homes in the area
Home Values in the Area
Average Home Value in this Area
Purchase History
| Date | Buyer | Sale Price | Title Company |
|---|---|---|---|
| Schulte David D | -- | None Available | |
| Schulte David D | $195,000 | North American Title Co | |
| Beltram Trina | -- | -- | |
| Beltram Trina | $80,000 | -- | |
| Citizens Federal Bank | $62,500 | Fidelity National Title Ins |
Source: Public Records
Mortgage History
| Date | Status | Borrower | Loan Amount |
|---|---|---|---|
| Open | Schulte David D | $156,000 | |
| Previous Owner | Beltram Trina | $72,000 |
Source: Public Records
Tax History
| Year | Tax Paid | Tax Assessment Tax Assessment Total Assessment is a certain percentage of the fair market value that is determined by local assessors to be the total taxable value of land and additions on the property. | Land | Improvement |
|---|---|---|---|---|
| 2025 | $3,336 | $288,048 | $70,898 | $217,150 |
| 2024 | $3,336 | $282,401 | $69,508 | $212,893 |
| 2023 | $3,282 | $276,865 | $68,146 | $208,719 |
| 2022 | $3,215 | $271,437 | $66,810 | $204,627 |
| 2021 | $3,160 | $266,115 | $65,500 | $200,615 |
| 2020 | $3,100 | $263,387 | $64,829 | $198,558 |
| 2019 | $3,036 | $258,223 | $63,558 | $194,665 |
| 2018 | $2,994 | $253,161 | $62,312 | $190,849 |
| 2017 | $2,969 | $248,198 | $61,091 | $187,107 |
| 2016 | $2,772 | $243,333 | $59,894 | $183,439 |
| 2015 | $2,768 | $239,679 | $58,995 | $180,684 |
| 2014 | $2,710 | $234,985 | $57,840 | $177,145 |
Source: Public Records
Map
Nearby Homes
- 2611 Foothill Dr
- 5132 El Camino Ave Unit 108
- 5132 El Camino Ave Unit 202
- 5216 Wyndham Oak Ln
- 5140 Whisper Oaks Ln
- 2855 La Colina Way
- 4837 Donnie Lyn Way
- 2334 Via Camino Ave
- 2432 Camino Garden Way
- 2905 Garfield Ave
- 5001 Boyd Dr
- 3041 Root Ave
- 4838 Robertson Ave
- 4951 Kurz Cir
- 5530 Kenneth Ave
- 4623 Hazelwood Ave
- 2940 Garfield Ave
- 2546 El Vita Way
- 5113 Walnut Garden Ct
- 3213 Smathers Way
- 2700 Walnut Ave
- 2720 Walnut Ave
- 5121 Kenneth Ave
- 2734 Walnut Ave
- 2709 Walnut Ave
- 5108 Kenneth Ave
- 2638 Walnut Ave
- 5135 Kenneth Ave
- 5045 Kenneth Ave
- 2750 Walnut Ave
- 5112 Kenneth Ave
- 5133 Kenneth Ave
- 5118 Kenneth Ave
- 5024 Kenneth Ave
- 2740 Walnut Ave
- 2628 Walnut Ave
- 5120 Kenneth Ave
- 5141 Kenneth Ave
- 5037 Kenneth Ave
- 5122 Kenneth Ave
Your Personal Tour Guide
Ask me questions while you tour the home.