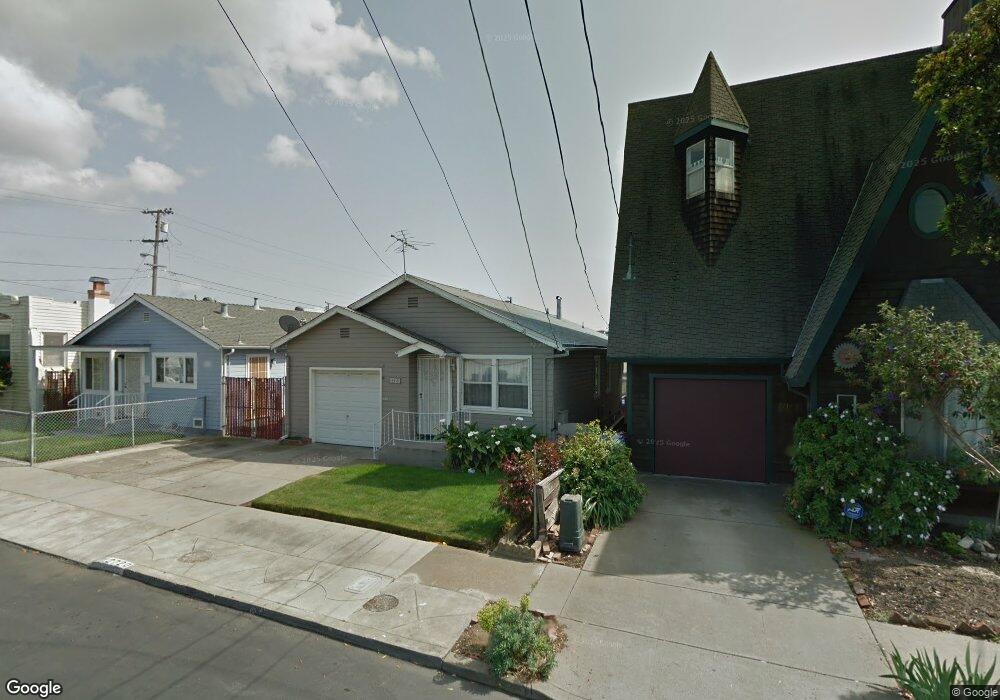
2720 Downer Ave Richmond, CA 94804
North & East NeighborhoodEstimated Value: $332,000 - $635,000
2
Beds
1
Bath
977
Sq Ft
$514/Sq Ft
Est. Value
About This Home
This home is located at 2720 Downer Ave, Richmond, CA 94804 and is currently estimated at $501,804, approximately $513 per square foot. 2720 Downer Ave is a home located in Contra Costa County with nearby schools including Michelle Obama School, Lovonya DeJean Middle School, and John F. Kennedy High School.
Ownership History
Date
Name
Owned For
Owner Type
Purchase Details
Closed on
Nov 27, 2012
Sold by
Sena Alfredo J
Bought by
Aguirre Jose G
Current Estimated Value
Home Financials for this Owner
Home Financials are based on the most recent Mortgage that was taken out on this home.
Original Mortgage
$137,464
Outstanding Balance
$95,195
Interest Rate
3.36%
Mortgage Type
FHA
Estimated Equity
$406,609
Purchase Details
Closed on
Nov 26, 2012
Sold by
Padilla Ma Evangelina
Bought by
Aguirre Jose G
Home Financials for this Owner
Home Financials are based on the most recent Mortgage that was taken out on this home.
Original Mortgage
$137,464
Outstanding Balance
$95,195
Interest Rate
3.36%
Mortgage Type
FHA
Estimated Equity
$406,609
Purchase Details
Closed on
May 18, 2005
Sold by
Sena Antonio and Sena Diolinda
Bought by
Sena Antonio and Sena Diolinda
Create a Home Valuation Report for This Property
The Home Valuation Report is an in-depth analysis detailing your home's value as well as a comparison with similar homes in the area
Home Values in the Area
Average Home Value in this Area
Purchase History
| Date | Buyer | Sale Price | Title Company |
|---|---|---|---|
| Aguirre Jose G | $140,000 | North American Title Company | |
| Aguirre Jose G | -- | North American Title Company | |
| Sena Antonio | -- | -- |
Source: Public Records
Mortgage History
| Date | Status | Borrower | Loan Amount |
|---|---|---|---|
| Open | Aguirre Jose G | $137,464 |
Source: Public Records
Tax History
| Year | Tax Paid | Tax Assessment Tax Assessment Total Assessment is a certain percentage of the fair market value that is determined by local assessors to be the total taxable value of land and additions on the property. | Land | Improvement |
|---|---|---|---|---|
| 2025 | $3,941 | $172,388 | $116,979 | $55,409 |
| 2024 | $3,839 | $169,009 | $114,686 | $54,323 |
| 2023 | $3,839 | $165,696 | $112,438 | $53,258 |
| 2022 | $3,740 | $162,448 | $110,234 | $52,214 |
| 2021 | $3,668 | $159,264 | $108,073 | $51,191 |
| 2019 | $3,436 | $154,542 | $104,868 | $49,674 |
| 2018 | $3,309 | $151,512 | $102,812 | $48,700 |
| 2017 | $3,218 | $148,543 | $100,797 | $47,746 |
| 2016 | $3,148 | $145,631 | $98,821 | $46,810 |
| 2015 | $3,108 | $143,444 | $97,337 | $46,107 |
| 2014 | $3,084 | $140,635 | $95,431 | $45,204 |
Source: Public Records
Map
Nearby Homes
- 2726 Downer Ave
- 2714 Downer Ave
- 2732 Downer Ave
- 2710 Downer Ave
- 717 28th St
- 709 28th St
- 2708 Downer Ave
- 2711 Clinton Ave
- 705 28th St
- 2702 Downer Ave
- 2707 Clinton Ave
- 2745 Downer Ave
- 2729 Clinton Ave
- 2802 Downer Ave
- 2807 Downer Ave
- 2640 Downer Ave
- 2649 Clinton Ave
- 2737 Downer Ave
- 712 28th St
- 2819 Downer Ave
Your Personal Tour Guide
Ask me questions while you tour the home.