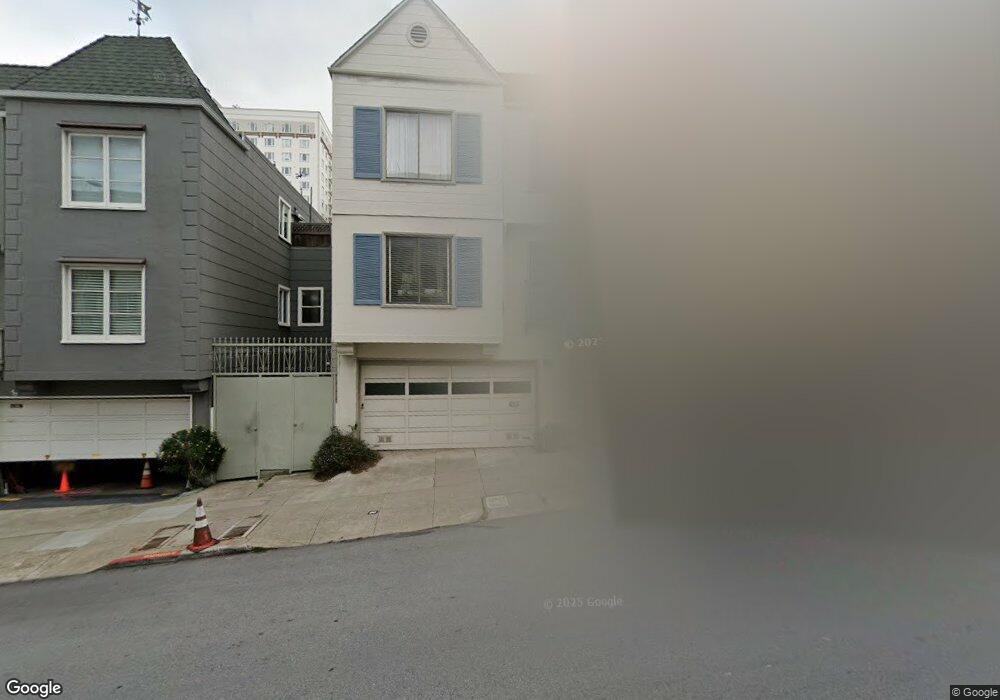
2720 Polk St Unit 2722 San Francisco, CA 94109
Russian Hill NeighborhoodEstimated Value: $1,816,000 - $2,575,489
--
Bed
2
Baths
2,250
Sq Ft
$945/Sq Ft
Est. Value
About This Home
This home is located at 2720 Polk St Unit 2722, San Francisco, CA 94109 and is currently estimated at $2,126,372, approximately $945 per square foot. 2720 Polk St Unit 2722 is a home located in San Francisco County with nearby schools including Yick Wo Elementary School, Francisco Middle School, and Saint Brigid Academy.
Ownership History
Date
Name
Owned For
Owner Type
Purchase Details
Closed on
Aug 30, 2016
Sold by
Hintermann Evelyn A
Bought by
Stebbins Charles B
Current Estimated Value
Home Financials for this Owner
Home Financials are based on the most recent Mortgage that was taken out on this home.
Original Mortgage
$1,335,000
Outstanding Balance
$1,067,032
Interest Rate
3.45%
Mortgage Type
Commercial
Estimated Equity
$1,059,340
Purchase Details
Closed on
Oct 26, 2009
Sold by
Jambor Louise Irma
Bought by
Jambor James J and Jambor Louise I
Purchase Details
Closed on
Feb 5, 2007
Sold by
Hintermann Evelyn A
Bought by
Hintermann Evelyn A
Purchase Details
Closed on
Jul 31, 1995
Sold by
Hintermann Jean A and Hintermann Evelyn A
Bought by
Hintermann Jean A and Hintermann Evelyn A
Create a Home Valuation Report for This Property
The Home Valuation Report is an in-depth analysis detailing your home's value as well as a comparison with similar homes in the area
Home Values in the Area
Average Home Value in this Area
Purchase History
| Date | Buyer | Sale Price | Title Company |
|---|---|---|---|
| Stebbins Charles B | $1,805,000 | First American Title Company | |
| Jambor James J | -- | None Available | |
| Hintermann Evelyn A | -- | None Available | |
| Hintermann Jean A | -- | -- |
Source: Public Records
Mortgage History
| Date | Status | Borrower | Loan Amount |
|---|---|---|---|
| Open | Stebbins Charles B | $1,335,000 |
Source: Public Records
Tax History Compared to Growth
Tax History
| Year | Tax Paid | Tax Assessment Tax Assessment Total Assessment is a certain percentage of the fair market value that is determined by local assessors to be the total taxable value of land and additions on the property. | Land | Improvement |
|---|---|---|---|---|
| 2025 | $25,062 | $2,094,851 | $1,466,397 | $628,454 |
| 2024 | $25,062 | $2,053,777 | $1,437,645 | $616,132 |
| 2023 | $24,599 | $2,013,507 | $1,409,456 | $604,051 |
| 2022 | $24,125 | $1,974,027 | $1,381,820 | $592,207 |
| 2021 | $23,703 | $1,935,322 | $1,354,726 | $580,596 |
| 2020 | $23,903 | $1,915,658 | $1,340,835 | $574,823 |
| 2019 | $23,088 | $1,878,101 | $1,314,545 | $563,556 |
| 2018 | $22,307 | $1,841,280 | $1,288,770 | $552,510 |
| 2017 | $2,272 | $143,844 | $58,884 | $84,960 |
| 2016 | $2,199 | $141,028 | $57,730 | $83,298 |
| 2015 | $2,166 | $138,914 | $56,864 | $82,050 |
| 2014 | $2,114 | $136,200 | $55,752 | $80,448 |
Source: Public Records
Map
Nearby Homes
- 1268 Lombard St Unit 1
- 1275 Lombard St
- 1380 Greenwich St Unit 205
- 1380 Greenwich St Unit 203
- 1043 Francisco St
- 1405 Greenwich St Unit 3
- 1345 Chestnut St
- 1080 Chestnut St Unit 11C
- 1080 Chestnut St Unit 11B
- 1080 Chestnut St Unit 1B
- 1374-1376 Chestnut St
- 1234 Francisco St Unit 5
- 1234 Francisco St Unit 4
- 2363 Larkin St Unit 34
- 2525 Van Ness Ave Unit 601
- Terrane-N3 Plan at Norvoir
- Terrane-T1 Plan at Norvoir
- Terrane-PH Plan at Norvoir
- 915 N Point St Unit D3
- Mariner-T2 Plan at Norvoir
- 2714 Polk St Unit 2716
- 2726 Polk St
- 2728 Polk St
- 2740 Polk St
- 2700 Polk St Unit 1
- 2700 Polk St Unit 6
- 2700 Polk St Unit 7
- 2700 Polk St Unit 4
- 2700 Polk St Unit 5
- 1280 Lombard St
- 1268 Lombard St Unit 4
- 1268 Lombard St Unit 2
- 1268 Lombard St Unit 1270
- 2750 Polk St
- 1183 Chestnut St
- 1181 Chestnut St
- 1304 Lombard St
- 1262 Lombard St Unit 1266
- 21 Culebra Terrace Unit 25
- 21-25 Culebra Terrace