Estimated Value: $250,000 - $349,000
3
Beds
1
Bath
1,407
Sq Ft
$219/Sq Ft
Est. Value
About This Home
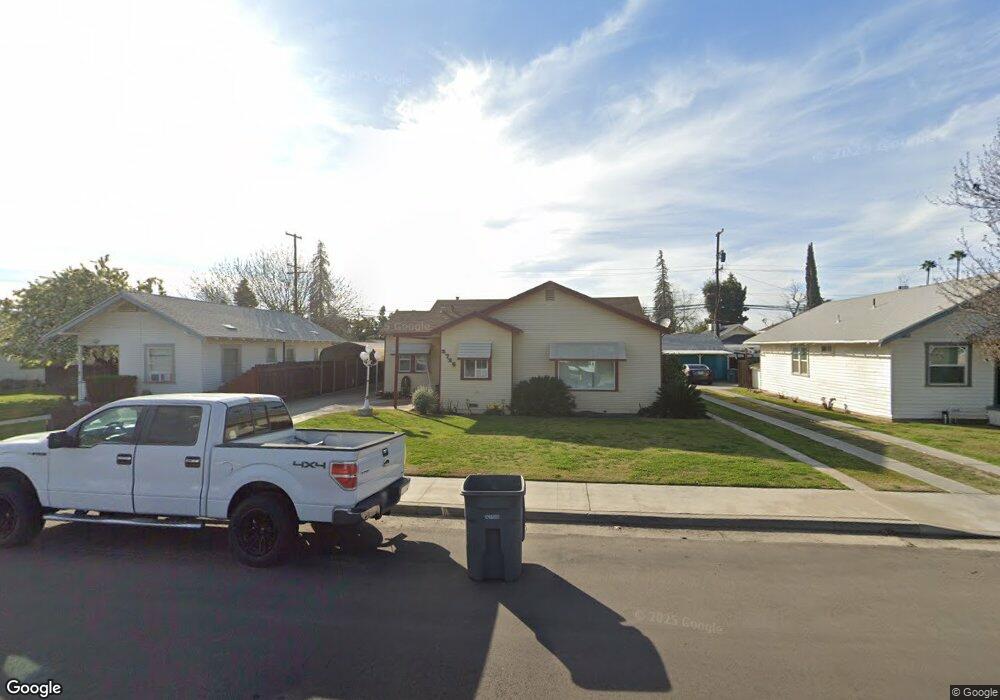
This home is located at 2725 A St, Selma, CA 93662 and is currently estimated at $308,792, approximately $219 per square foot. 2725 A St is a home located in Fresno County with nearby schools including Theodore Roosevelt Elementary School, Abraham Lincoln Middle School, and Selma High School.
Ownership History
Date
Name
Owned For
Owner Type
Purchase Details
Closed on
Jan 27, 2022
Sold by
Robert Clifton
Bought by
Alyssa And Robert Clifton Family Trust and Fami Robert
Current Estimated Value
Purchase Details
Closed on
Jun 1, 2016
Sold by
Terry Janet A
Bought by
Clifton Robert Andrew
Home Financials for this Owner
Home Financials are based on the most recent Mortgage that was taken out on this home.
Original Mortgage
$30,000
Interest Rate
3.66%
Mortgage Type
Purchase Money Mortgage
Create a Home Valuation Report for This Property
The Home Valuation Report is an in-depth analysis detailing your home's value as well as a comparison with similar homes in the area
Home Values in the Area
Average Home Value in this Area
Purchase History
| Date | Buyer | Sale Price | Title Company |
|---|---|---|---|
| Alyssa And Robert Clifton Family Trust | -- | Gill Estate Law Pc | |
| Clifton Robert | -- | Gill Estate Law Pc | |
| Clifton Robert Andrew | $99,000 | Chicago Title Company |
Source: Public Records
Mortgage History
| Date | Status | Borrower | Loan Amount |
|---|---|---|---|
| Previous Owner | Clifton Robert Andrew | $30,000 |
Source: Public Records
Tax History
| Year | Tax Paid | Tax Assessment Tax Assessment Total Assessment is a certain percentage of the fair market value that is determined by local assessors to be the total taxable value of land and additions on the property. | Land | Improvement |
|---|---|---|---|---|
| 2025 | $3,042 | $171,643 | $47,348 | $124,295 |
| 2023 | $2,952 | $164,979 | $45,510 | $119,469 |
| 2022 | $2,787 | $161,745 | $44,618 | $117,127 |
| 2021 | $2,720 | $158,575 | $43,744 | $114,831 |
| 2020 | $2,689 | $156,950 | $43,296 | $113,654 |
| 2019 | $2,616 | $153,874 | $42,448 | $111,426 |
| 2018 | $2,554 | $150,858 | $41,616 | $109,242 |
| 2017 | $2,472 | $147,900 | $40,800 | $107,100 |
| 2016 | $1,165 | $51,476 | $9,930 | $41,546 |
| 2015 | $1,172 | $50,703 | $9,781 | $40,922 |
| 2014 | $1,126 | $49,711 | $9,590 | $40,121 |
Source: Public Records
Map
Nearby Homes
- 12623 S Mccall Ave
- 2002 Merced St
- 2629 Mccall Ave
- 1517 Stillman St
- 0 Rose Ave
- 2221 Floral Ave
- 2226 Arrants St
- 2980 Olive St
- 2020 Aspen St
- 1607 Cooper St
- 2482 Country Club Ln
- 2116 Sylvia St
- 2753 Thompson Ave
- 2510 Whitson St
- 2772 Valley View St
- 2405 Country Club Ln
- 2222 Barbara St
- 3239 Lee St
- 2561 Stillman St Unit 111
- 1340 Lewis St
Your Personal Tour Guide
Ask me questions while you tour the home.