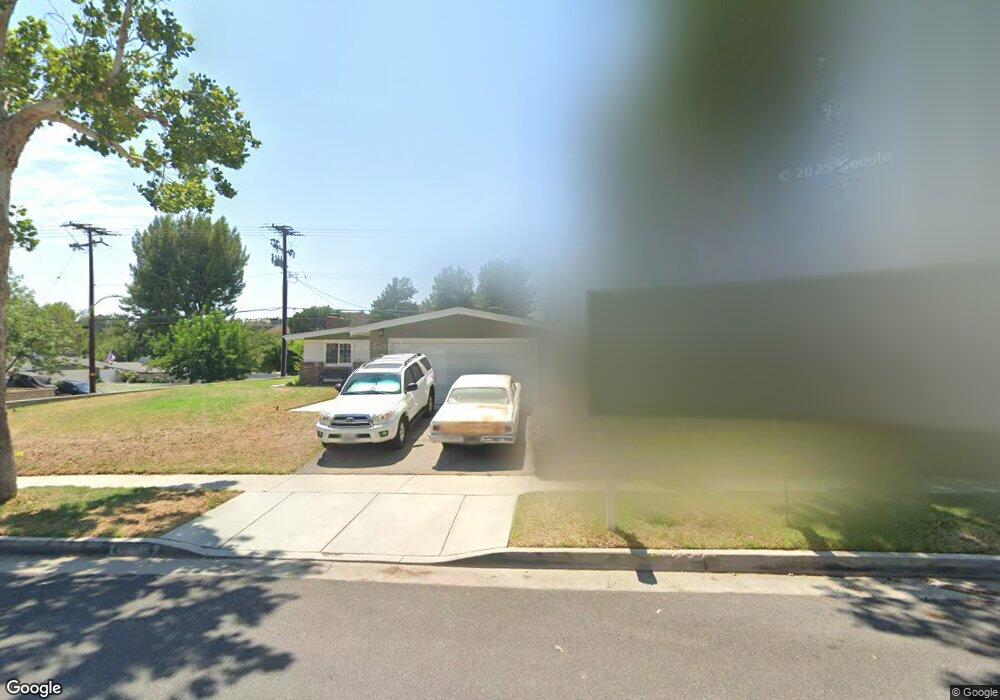
27303 Santa Clarita Rd Santa Clarita, CA 91350
Saugus NeighborhoodEstimated Value: $684,000 - $733,000
3
Beds
2
Baths
1,230
Sq Ft
$583/Sq Ft
Est. Value
About This Home
This home is located at 27303 Santa Clarita Rd, Santa Clarita, CA 91350 and is currently estimated at $716,962, approximately $582 per square foot. 27303 Santa Clarita Rd is a home located in Los Angeles County with nearby schools including James Foster Elementary School, Arroyo Seco Junior High School, and Saugus High School.
Ownership History
Date
Name
Owned For
Owner Type
Purchase Details
Closed on
Feb 1, 2006
Sold by
Robideaux Thomas G and Robideaux Crista M
Bought by
Robideaux Thomas G and Robideaux Crista M
Current Estimated Value
Purchase Details
Closed on
Oct 14, 1999
Sold by
Kelly Triny M and Kelly Michael F
Bought by
Robideaux Thomas G and Robideaux Crista M
Home Financials for this Owner
Home Financials are based on the most recent Mortgage that was taken out on this home.
Original Mortgage
$150,300
Interest Rate
7.82%
Mortgage Type
Balloon
Purchase Details
Closed on
Oct 21, 1998
Sold by
Geary Brian and Geary Denise
Bought by
Kelly Michael F and Kelly Triny M
Home Financials for this Owner
Home Financials are based on the most recent Mortgage that was taken out on this home.
Original Mortgage
$166,700
Interest Rate
6.78%
Create a Home Valuation Report for This Property
The Home Valuation Report is an in-depth analysis detailing your home's value as well as a comparison with similar homes in the area
Home Values in the Area
Average Home Value in this Area
Purchase History
| Date | Buyer | Sale Price | Title Company |
|---|---|---|---|
| Robideaux Thomas G | -- | None Available | |
| Robideaux Thomas G | $188,000 | Investors Title Company | |
| Kelly Michael F | $175,500 | Lawyers Title Company |
Source: Public Records
Mortgage History
| Date | Status | Borrower | Loan Amount |
|---|---|---|---|
| Closed | Robideaux Thomas G | $150,300 | |
| Previous Owner | Kelly Michael F | $166,700 | |
| Closed | Robideaux Thomas G | $37,600 |
Source: Public Records
Tax History Compared to Growth
Tax History
| Year | Tax Paid | Tax Assessment Tax Assessment Total Assessment is a certain percentage of the fair market value that is determined by local assessors to be the total taxable value of land and additions on the property. | Land | Improvement |
|---|---|---|---|---|
| 2025 | $4,942 | $330,715 | $177,353 | $153,362 |
| 2024 | $4,709 | $324,231 | $173,876 | $150,355 |
| 2023 | $4,563 | $317,874 | $170,467 | $147,407 |
| 2022 | $4,577 | $311,642 | $167,125 | $144,517 |
| 2021 | $4,500 | $305,533 | $163,849 | $141,684 |
| 2019 | $4,341 | $296,473 | $158,990 | $137,483 |
| 2018 | $4,204 | $290,661 | $155,873 | $134,788 |
| 2016 | $3,962 | $279,376 | $149,821 | $129,555 |
| 2015 | $3,813 | $275,180 | $147,571 | $127,609 |
| 2014 | $3,751 | $269,791 | $144,681 | $125,110 |
Source: Public Records
Map
Nearby Homes
- 27362 Santa Clarita Rd
- 22660 La Rochelle Dr
- 22654 La Rochelle Dr
- 27439 Santa Clarita Rd
- 22949 Sycamore Creek Dr
- 22403 Los Rogues Dr
- 27127 Rio Bosque Dr
- 27573 Santa Clarita Rd
- 22903 Vista Delgado Dr
- 22346 Cheraw Dr
- 27240 Trenton Place
- 27619 Ron Ridge Dr
- 27717 Sequoia Glen Dr
- 27371 Blueridge Dr
- 27021 Rio Bosque Dr
- 27302 Weathersfield Dr
- 27829 Carnegie Ave
- 22810 Rio Chico Dr
- 22725 Garzota Dr
- 27929 Dexter Dr
- 27311 Santa Clarita Rd
- 22657 Los Rogues Dr
- 27317 Santa Claria
- 27317 Santa Clarita Rd
- 22646 Los Rogues Dr
- 22652 Los Rogues Dr
- 22638 Los Rogues Dr
- 27306 Santa Clarita Rd
- 27316 Seco Canyon Rd
- 22660 Los Rogues Dr
- 27312 Santa Clarita Rd
- 27325 Santa Clarita Rd
- 22630 Los Rogues Dr
- 27324 Seco Canyon Rd
- 22625 Guadilamar Dr
- 22619 Los Rogues Dr
- 22631 Guadilamar Dr
- 22617 Guadilamar Dr
- 22646 Aguadero Place
- 22624 Los Rogues Dr