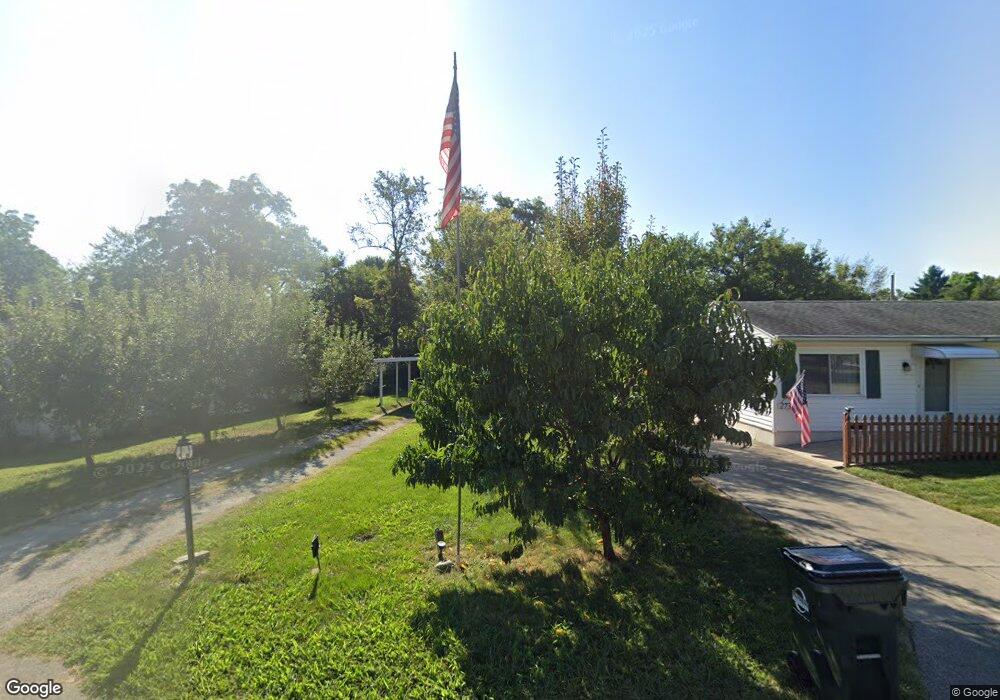
2732 Circle View Dr Dayton, OH 45419
Estimated Value: $107,935 - $154,000
2
Beds
1
Bath
640
Sq Ft
$210/Sq Ft
Est. Value
About This Home
This home is located at 2732 Circle View Dr, Dayton, OH 45419 and is currently estimated at $134,234, approximately $209 per square foot. 2732 Circle View Dr is a home located in Montgomery County with nearby schools including Beavertown Elementary School, Kettering Middle School, and Kettering Fairmont High School.
Ownership History
Date
Name
Owned For
Owner Type
Purchase Details
Closed on
Oct 5, 2018
Sold by
Port Company Llc
Bought by
Hood James S and Garvey Julie E
Current Estimated Value
Home Financials for this Owner
Home Financials are based on the most recent Mortgage that was taken out on this home.
Original Mortgage
$78,000
Outstanding Balance
$68,021
Interest Rate
4.5%
Mortgage Type
Future Advance Clause Open End Mortgage
Estimated Equity
$66,213
Purchase Details
Closed on
Jan 12, 2016
Sold by
Federal Home Loan Mortgage Corporation
Bought by
Port Company Llc
Purchase Details
Closed on
Sep 20, 2015
Sold by
Allen Maria A and Allen Fred
Bought by
Federal Home Loan Mortgage Corporation
Purchase Details
Closed on
Dec 17, 1996
Sold by
Shear Chester A
Bought by
Allen Maria A and Allen Winifred A
Purchase Details
Closed on
Feb 29, 1996
Sold by
Mckibbin Stephen P
Bought by
Shear Chester A
Create a Home Valuation Report for This Property
The Home Valuation Report is an in-depth analysis detailing your home's value as well as a comparison with similar homes in the area
Home Values in the Area
Average Home Value in this Area
Purchase History
| Date | Buyer | Sale Price | Title Company |
|---|---|---|---|
| Hood James S | -- | Sterling Land Title Agency I | |
| Port Company Llc | -- | None Available | |
| Federal Home Loan Mortgage Corporation | -- | Omega Title Agency Llc | |
| Allen Maria A | $51,500 | -- | |
| Shear Chester A | -- | -- |
Source: Public Records
Mortgage History
| Date | Status | Borrower | Loan Amount |
|---|---|---|---|
| Open | Hood James S | $78,000 |
Source: Public Records
Tax History Compared to Growth
Tax History
| Year | Tax Paid | Tax Assessment Tax Assessment Total Assessment is a certain percentage of the fair market value that is determined by local assessors to be the total taxable value of land and additions on the property. | Land | Improvement |
|---|---|---|---|---|
| 2024 | $1,820 | $28,980 | $8,510 | $20,470 |
| 2023 | $1,820 | $28,980 | $8,510 | $20,470 |
| 2022 | $1,437 | $18,000 | $5,290 | $12,710 |
| 2021 | $1,331 | $18,000 | $5,290 | $12,710 |
| 2020 | $1,335 | $18,000 | $5,290 | $12,710 |
| 2019 | $1,371 | $16,360 | $5,290 | $11,070 |
| 2018 | $1,409 | $16,360 | $5,290 | $11,070 |
| 2017 | $1,302 | $16,360 | $5,290 | $11,070 |
| 2016 | $1,269 | $14,970 | $5,290 | $9,680 |
| 2015 | $512 | $14,970 | $5,290 | $9,680 |
| 2014 | $512 | $14,970 | $5,290 | $9,680 |
| 2012 | -- | $16,340 | $5,270 | $11,070 |
Source: Public Records
Map
Nearby Homes
- 1024 Ansel Dr
- 2817 Winton Dr
- 962 Broad Blvd
- 2729 Haig Ave
- 2905 Acorn Dr
- 1116 Hale Ave
- 2917 California Ave
- 3168 Cobblestone Ln Unit 103168
- 663 Broad Blvd
- 3209 Waltham Ave
- 3209 Carrier Ave
- 651 Broad Blvd
- 3198 Sagamon Ave Unit 13198
- 813 Rockhill Ave
- 2500 Oak Park Ave
- 2817 Royalston Ave
- 1629 Beaver Creek Ln
- 1417 Dutchess Ave
- 900 Garrison Ave
- 2758 Sutton Ave
- 2728 Circle View Dr
- 2736 Circle View Dr
- 2726 Circle View Dr
- 2744 Circle View Dr
- 2779 South Blvd
- 2724 Circle View Dr
- 2733 Circle View Dr
- 2783 South Blvd
- 2775 South Blvd
- 2737 Circle View Dr
- 2720 Circle View Dr
- 2791 South Blvd
- 2740 Gaylord Ave
- 2771 South Blvd
- 2738 Gaylord Ave
- 2716 Circle View Dr
- 2767 South Blvd
- 2751 Gaylord Ave
- 1032 Ansel Dr
- 1036 Ansel Dr