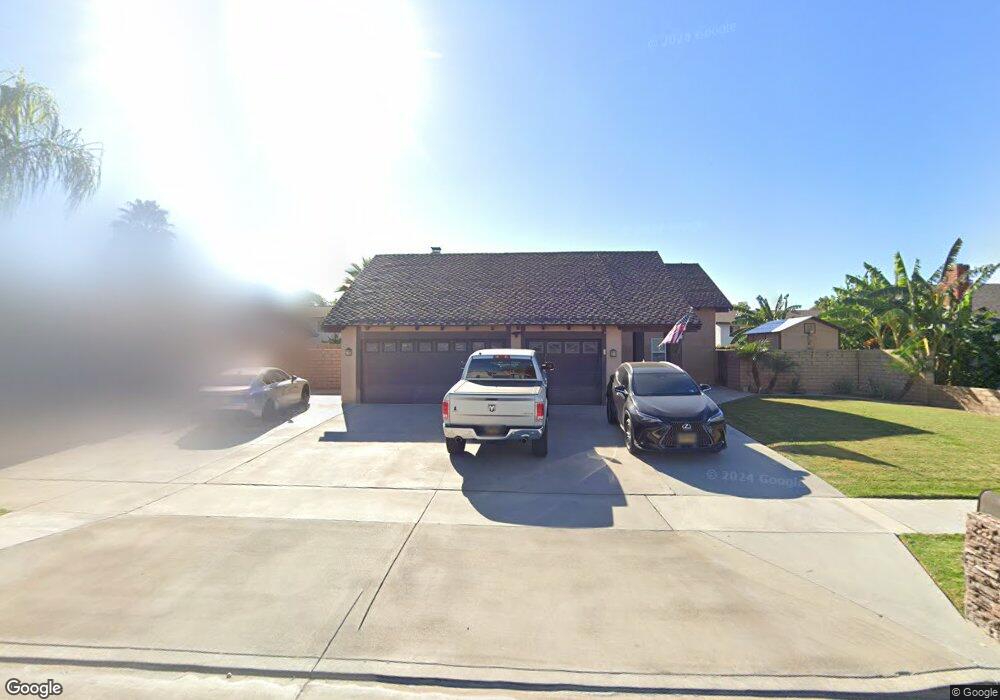
2742 Butterfield Rd Riverside, CA 92503
Arlington South NeighborhoodEstimated Value: $704,000 - $836,000
4
Beds
3
Baths
2,796
Sq Ft
$275/Sq Ft
Est. Value
About This Home
This home is located at 2742 Butterfield Rd, Riverside, CA 92503 and is currently estimated at $768,299, approximately $274 per square foot. 2742 Butterfield Rd is a home located in Riverside County with nearby schools including Harrison Elementary School, Chemawa Middle School, and Arlington High School.
Ownership History
Date
Name
Owned For
Owner Type
Purchase Details
Closed on
Aug 26, 2010
Sold by
Bank Of America National Association
Bought by
Marzola Marco and Marzola Paula
Current Estimated Value
Purchase Details
Closed on
Jan 28, 2010
Sold by
Doby Shirley Marie
Bought by
Bank Of America National Association
Purchase Details
Closed on
Jul 9, 2009
Sold by
Doby Shirley Marie
Bought by
Rancho Horizon Llc
Purchase Details
Closed on
Aug 31, 1995
Sold by
Emc Mtg Corp
Bought by
Doby Shirley Marie
Home Financials for this Owner
Home Financials are based on the most recent Mortgage that was taken out on this home.
Original Mortgage
$137,219
Interest Rate
7.58%
Mortgage Type
FHA
Purchase Details
Closed on
Dec 1, 1994
Sold by
Great Western Bank Fsb
Bought by
Emc Mtg Corp
Purchase Details
Closed on
Oct 26, 1994
Sold by
Kelly William R and Kelly Mary A
Bought by
Great Western Bank Fsb
Create a Home Valuation Report for This Property
The Home Valuation Report is an in-depth analysis detailing your home's value as well as a comparison with similar homes in the area
Home Values in the Area
Average Home Value in this Area
Purchase History
| Date | Buyer | Sale Price | Title Company |
|---|---|---|---|
| Marzola Marco | $218,000 | First American Title Company | |
| Bank Of America National Association | $260,000 | None Available | |
| Rancho Horizon Llc | $170,000 | Accommodation | |
| Doby Shirley Marie | $140,500 | Chicago Title Co | |
| Emc Mtg Corp | $113,000 | Chicago Title Company | |
| Great Western Bank Fsb | $101,500 | Chicago Title Company |
Source: Public Records
Mortgage History
| Date | Status | Borrower | Loan Amount |
|---|---|---|---|
| Previous Owner | Doby Shirley Marie | $137,219 |
Source: Public Records
Tax History Compared to Growth
Tax History
| Year | Tax Paid | Tax Assessment Tax Assessment Total Assessment is a certain percentage of the fair market value that is determined by local assessors to be the total taxable value of land and additions on the property. | Land | Improvement |
|---|---|---|---|---|
| 2025 | $3,373 | $308,167 | $64,048 | $244,119 |
| 2023 | $3,373 | $296,203 | $61,562 | $234,641 |
| 2022 | $3,297 | $290,396 | $60,355 | $230,041 |
| 2021 | $3,260 | $284,703 | $59,172 | $225,531 |
| 2020 | $3,236 | $281,785 | $58,566 | $223,219 |
| 2019 | $3,175 | $276,261 | $57,418 | $218,843 |
| 2018 | $3,114 | $270,845 | $56,294 | $214,551 |
| 2017 | $3,059 | $265,536 | $55,191 | $210,345 |
| 2016 | $2,864 | $260,330 | $54,109 | $206,221 |
| 2015 | $2,823 | $256,422 | $53,298 | $203,124 |
| 2014 | $2,797 | $251,401 | $52,255 | $199,146 |
Source: Public Records
Map
Nearby Homes
- 9539 Hermitage Ln
- 2875 Myers St
- 2969 Crestwood Place
- 2945 Myers St
- 2885 Bordeaux Dr
- 3500 3500 Buchanan Unit 103
- 0 Seven Hills Dr Unit IG24212380
- 0 Road Runner Ridge Unit NP25232115
- 0 Via Verrazano Unit IV25221760
- 0 Vacant Land Unit IV25200552
- 0 Vacant Land Unit IV25136922
- 9830 Cleveland Ave
- 3070 Linda Lou Ln
- 2922 Joshua Tree Rd
- SEC Van Buren Blvd
- 9158 Teralina Cir
- 9154 Teralina Cir
- 9146 Teralina Cir
- 9150 Teralina Cir
- PLAN TWO at Emberwood
- 2752 Butterfield Rd
- 2732 Butterfield Rd
- 2741 Dunbar Dr
- 2751 Dunbar Dr
- 2731 Dunbar Dr
- 9568 Calle Del Casa
- 2762 Butterfield Rd
- 2722 Butterfield Rd
- 2761 Dunbar Dr
- 2721 Dunbar Dr
- 9565 Calle la Cuesta
- 9569 Calle Del Casa
- 2802 Butterfield Rd
- 9558 Calle Del Casa
- 2805 Dunbar Dr
- 2742 Dunbar Dr
- 9559 Calle Del Casa
- 9555 Calle la Cuesta
- 2752 Dunbar Dr
- 2732 Dunbar Dr