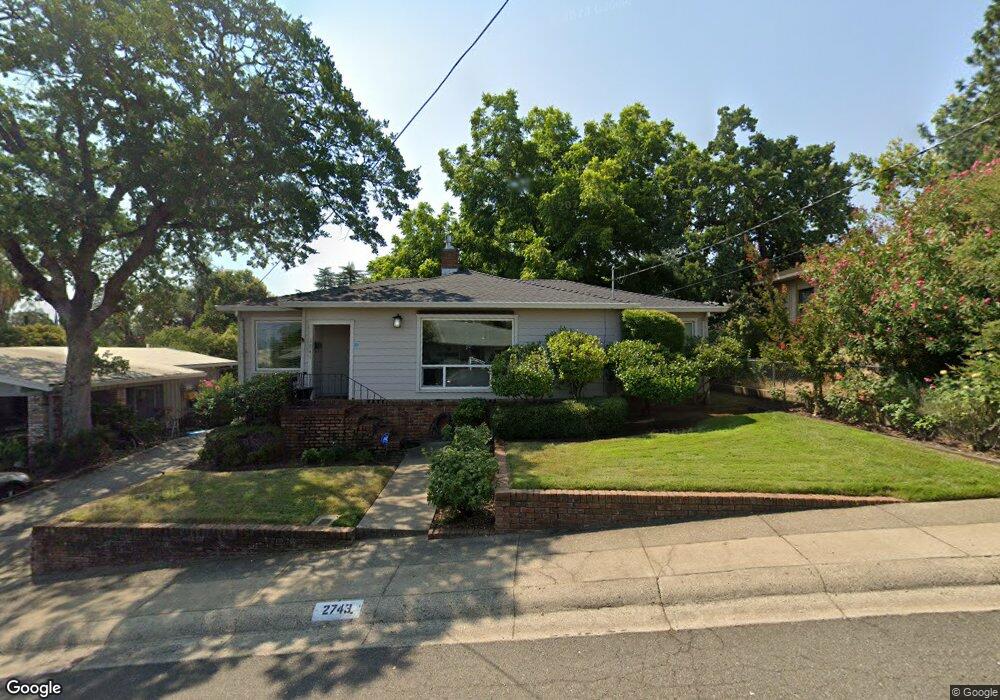
2743 Foothill Blvd Redding, CA 96001
Manzanita NeighborhoodEstimated Value: $277,005 - $317,000
2
Beds
1
Bath
1,316
Sq Ft
$227/Sq Ft
Est. Value
About This Home
This home is located at 2743 Foothill Blvd, Redding, CA 96001 and is currently estimated at $298,501, approximately $226 per square foot. 2743 Foothill Blvd is a home located in Shasta County with nearby schools including Manzanita Elementary School, Sequoia Middle School, and Shasta High School.
Ownership History
Date
Name
Owned For
Owner Type
Purchase Details
Closed on
Oct 1, 2013
Sold by
Guest Gayle
Bought by
Guest Gayle A
Current Estimated Value
Purchase Details
Closed on
Jul 18, 2011
Sold by
Guest Gayle and Cashel Gayle
Bought by
Guest Gayle
Home Financials for this Owner
Home Financials are based on the most recent Mortgage that was taken out on this home.
Original Mortgage
$120,000
Interest Rate
4.45%
Mortgage Type
New Conventional
Purchase Details
Closed on
Nov 23, 2005
Sold by
Cashel William F
Bought by
Guest Gayle and Cashel Gayle
Purchase Details
Closed on
Aug 23, 2002
Sold by
Guest Phyllis I
Bought by
Cashel Gayle
Create a Home Valuation Report for This Property
The Home Valuation Report is an in-depth analysis detailing your home's value as well as a comparison with similar homes in the area
Home Values in the Area
Average Home Value in this Area
Purchase History
| Date | Buyer | Sale Price | Title Company |
|---|---|---|---|
| Guest Gayle A | -- | None Available | |
| Guest Gayle | -- | Fidelity Natl Title Co Of Ca | |
| Guest Gayle | -- | -- | |
| Cashel Gayle | -- | -- |
Source: Public Records
Mortgage History
| Date | Status | Borrower | Loan Amount |
|---|---|---|---|
| Closed | Guest Gayle | $120,000 |
Source: Public Records
Tax History
| Year | Tax Paid | Tax Assessment Tax Assessment Total Assessment is a certain percentage of the fair market value that is determined by local assessors to be the total taxable value of land and additions on the property. | Land | Improvement |
|---|---|---|---|---|
| 2025 | $1,651 | $164,659 | $43,320 | $121,339 |
| 2024 | $1,625 | $161,431 | $42,471 | $118,960 |
| 2023 | $1,625 | $158,267 | $41,639 | $116,628 |
| 2022 | $1,596 | $155,165 | $40,823 | $114,342 |
| 2021 | $1,586 | $152,123 | $40,023 | $112,100 |
| 2020 | $1,606 | $150,564 | $39,613 | $110,951 |
| 2019 | $1,523 | $147,613 | $38,837 | $108,776 |
| 2018 | $1,535 | $144,720 | $38,076 | $106,644 |
| 2017 | $1,525 | $141,883 | $37,330 | $104,553 |
| 2016 | $1,475 | $139,102 | $36,599 | $102,503 |
| 2015 | $1,456 | $137,014 | $36,050 | $100,964 |
| 2014 | $1,444 | $134,331 | $35,344 | $98,987 |
Source: Public Records
Map
Nearby Homes
- 2565 North St
- 1025 Chardonnay Walk
- 2351 Eureka Way
- 3126 Riesling Path
- 1170 Orange Ave
- 3320 Stratford Ave
- 1129 Magnolia Ave
- 2327 Butte St
- 2315 Butte St
- 1545 Olive Ave
- 1525 Oak St
- 1355 Bambury Ct
- 3345 Oakwood Place
- 1377 Willis St
- 416 Arbor Place
- 582 River Oaks Dr
- 531 Aurora Place
- 3330 Scenic Dr
- 1777 Magnolia Ave
- 3410 Scenic Dr
- 2733 Foothill Blvd
- 2753 Foothill Blvd
- 1105 Hillcrest Ave
- 1155 Hillcrest Ave
- 2726 Foothill Blvd
- 2716 Foothill Blvd
- 2736 Foothill Blvd
- 1105 Circle Dr
- 1165 Hillcrest Ave
- 2706 Foothill Blvd
- 2680 Foothill Blvd
- 2651 Foothill Blvd
- 1175 Hillcrest Ave
- 2670 Foothill Blvd
- 1095 Hillcrest Ave
- 2746 Foothill Blvd
- 1170 Almond Ave
- 1124 Almond Ave
- 1170 Circle Dr
- 2627 Foothill Blvd Unit 1
Your Personal Tour Guide
Ask me questions while you tour the home.