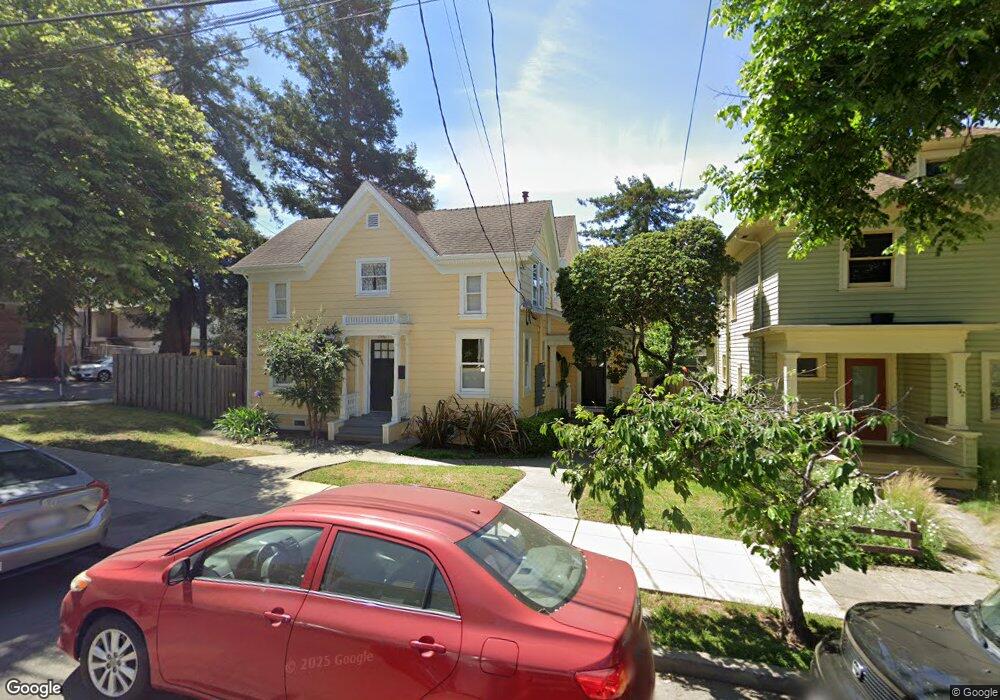
2746 Garber St Berkeley, CA 94705
Elmwood NeighborhoodEstimated Value: $1,730,000 - $3,640,019
6
Beds
3
Baths
2,811
Sq Ft
$841/Sq Ft
Est. Value
About This Home
This home is located at 2746 Garber St, Berkeley, CA 94705 and is currently estimated at $2,365,005, approximately $841 per square foot. 2746 Garber St is a home located in Alameda County with nearby schools including Emerson Elementary School, John Muir Elementary School, and Malcolm X Elementary School.
Ownership History
Date
Name
Owned For
Owner Type
Purchase Details
Closed on
Jan 25, 2023
Sold by
Ph Trust
Bought by
Garber Street Llc
Current Estimated Value
Purchase Details
Closed on
Sep 15, 2014
Sold by
Headley Mark W and Pehl Christina J
Bought by
Ph Trust
Purchase Details
Closed on
Apr 26, 2010
Sold by
Watson Peter
Bought by
Pehl Christina J and Headley Mark W
Purchase Details
Closed on
Jun 27, 1997
Sold by
Mainson Pauline Cederberg Fuller and Pauline F Mainson Revocable Li
Bought by
Watson Peter and Watson Elisabeth
Home Financials for this Owner
Home Financials are based on the most recent Mortgage that was taken out on this home.
Original Mortgage
$182,500
Interest Rate
7.91%
Mortgage Type
Seller Take Back
Create a Home Valuation Report for This Property
The Home Valuation Report is an in-depth analysis detailing your home's value as well as a comparison with similar homes in the area
Home Values in the Area
Average Home Value in this Area
Purchase History
| Date | Buyer | Sale Price | Title Company |
|---|---|---|---|
| Garber Street Llc | -- | -- | |
| Ph Trust | -- | None Available | |
| Pehl Christina J | $1,380,000 | Placer Title Company | |
| Watson Peter | $312,500 | First American Title Guarant |
Source: Public Records
Mortgage History
| Date | Status | Borrower | Loan Amount |
|---|---|---|---|
| Previous Owner | Watson Peter | $182,500 |
Source: Public Records
Tax History
| Year | Tax Paid | Tax Assessment Tax Assessment Total Assessment is a certain percentage of the fair market value that is determined by local assessors to be the total taxable value of land and additions on the property. | Land | Improvement |
|---|---|---|---|---|
| 2025 | $25,833 | $1,781,207 | $534,362 | $1,246,845 |
| 2024 | $25,833 | $1,746,293 | $523,888 | $1,222,405 |
| 2023 | $25,314 | $1,712,054 | $513,616 | $1,198,438 |
| 2022 | $24,897 | $1,678,493 | $503,548 | $1,174,945 |
| 2021 | $24,981 | $1,645,594 | $493,678 | $1,151,916 |
| 2020 | $23,726 | $1,628,730 | $488,619 | $1,140,111 |
| 2019 | $22,889 | $1,596,797 | $479,039 | $1,117,758 |
| 2018 | $22,530 | $1,565,498 | $469,649 | $1,095,849 |
| 2017 | $21,775 | $1,534,807 | $460,442 | $1,074,365 |
| 2016 | $21,153 | $1,504,724 | $451,417 | $1,053,307 |
| 2015 | $20,885 | $1,482,133 | $444,640 | $1,037,493 |
| 2014 | $20,894 | $1,453,111 | $435,933 | $1,017,178 |
Source: Public Records
Map
Nearby Homes
- 2817 Palm Ct
- 2632 Warring St Unit 3
- 2643 Stuart St
- 2601 College Ave Unit 203
- 2601 College Ave Unit 208
- 2962 Piedmont Ave
- 190 Stonewall Rd
- 2935 Florence St
- 2535 Chilton Way
- 2702 Dana St
- 2917 Telegraph Ave
- 2509 Dwight Way
- 2477 Prince St
- 2319 Ward St
- 2 Panoramic Way Unit 105
- 2 Panoramic Way Unit 304
- 161 Panoramic Way
- 2550 Dana St Unit 2F
- 0 Panoramic Way Unit 41118724
- 6446 Colby St
- 2742 Garber St
- 2752 Piedmont Ave
- 2740 Garber St
- 2738 Garber St Unit Cinnabar
- 2754 Piedmont Ave
- 2800 Garber St
- 2802 Garber St
- 2758 Piedmont Ave
- 2747 Stuart St
- 2739 Stuart St
- 2734 Piedmont Ave
- 2730 Garber St
- 2808 Garber St
- 2753 Piedmont Ave
- 2741 Garber St Unit 6
- 2741 Garber St Unit 5
- 2741 Garber St Unit 4
- 2741 Garber St Unit 3
- 2741 Garber St Unit 2
- 2741 Garber St Unit 1
Your Personal Tour Guide
Ask me questions while you tour the home.