27464 Jasmine Ave Unit 210 Mission Viejo, CA 92692
Estimated Value: $764,647 - $828,000
3
Beds
2
Baths
1,148
Sq Ft
$693/Sq Ft
Est. Value
About This Home
This home is located at 27464 Jasmine Ave Unit 210, Mission Viejo, CA 92692 and is currently estimated at $795,162, approximately $692 per square foot. 27464 Jasmine Ave Unit 210 is a home located in Orange County with nearby schools including Carl Hankey Middle School, Capistrano Valley High School, and Mission Montessori.
Ownership History
Date
Name
Owned For
Owner Type
Purchase Details
Closed on
Aug 2, 2018
Sold by
Bulman Yoko
Bought by
Bulman Erik and Bulman Yoko I
Current Estimated Value
Purchase Details
Closed on
Oct 30, 2017
Sold by
Bulman Yoko and Bulman Erik
Bought by
Bulman Yoko
Home Financials for this Owner
Home Financials are based on the most recent Mortgage that was taken out on this home.
Original Mortgage
$131,400
Outstanding Balance
$72,158
Interest Rate
3.83%
Mortgage Type
New Conventional
Estimated Equity
$723,004
Purchase Details
Closed on
Apr 14, 2003
Sold by
Stockwell Melora Lee
Bought by
Inokuma Yoko
Home Financials for this Owner
Home Financials are based on the most recent Mortgage that was taken out on this home.
Original Mortgage
$236,500
Interest Rate
4.37%
Mortgage Type
Purchase Money Mortgage
Create a Home Valuation Report for This Property
The Home Valuation Report is an in-depth analysis detailing your home's value as well as a comparison with similar homes in the area
Home Values in the Area
Average Home Value in this Area
Purchase History
| Date | Buyer | Sale Price | Title Company |
|---|---|---|---|
| Bulman Erik | -- | None Available | |
| Bulman Yoko | -- | Timios Title | |
| Inokuma Yoko | $316,500 | Southland Title |
Source: Public Records
Mortgage History
| Date | Status | Borrower | Loan Amount |
|---|---|---|---|
| Open | Bulman Yoko | $131,400 | |
| Closed | Inokuma Yoko | $236,500 |
Source: Public Records
Tax History Compared to Growth
Tax History
| Year | Tax Paid | Tax Assessment Tax Assessment Total Assessment is a certain percentage of the fair market value that is determined by local assessors to be the total taxable value of land and additions on the property. | Land | Improvement |
|---|---|---|---|---|
| 2025 | $4,562 | $458,389 | $313,884 | $144,505 |
| 2024 | $4,562 | $449,401 | $307,729 | $141,672 |
| 2023 | $4,465 | $440,590 | $301,695 | $138,895 |
| 2022 | $4,380 | $431,951 | $295,779 | $136,172 |
| 2021 | $4,296 | $423,482 | $289,980 | $133,502 |
| 2020 | $4,253 | $419,140 | $287,006 | $132,134 |
| 2019 | $4,170 | $410,922 | $281,378 | $129,544 |
| 2018 | $4,090 | $402,865 | $275,861 | $127,004 |
| 2017 | $4,010 | $394,966 | $270,452 | $124,514 |
| 2016 | $3,933 | $387,222 | $265,149 | $122,073 |
| 2015 | $3,891 | $381,406 | $261,166 | $120,240 |
| 2014 | $3,817 | $373,935 | $256,050 | $117,885 |
Source: Public Records
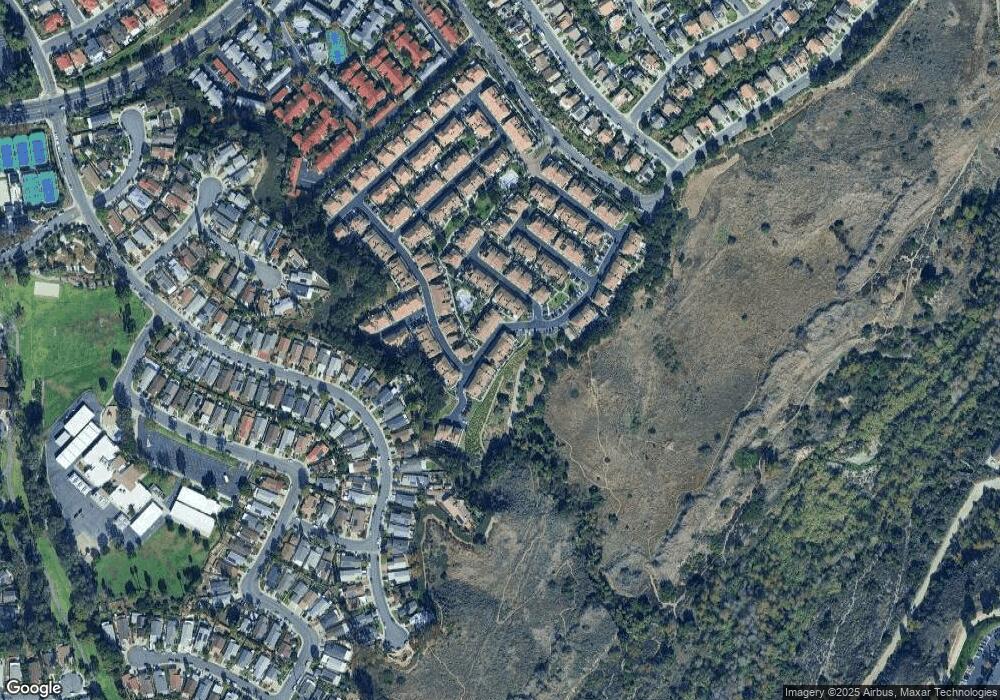
Map
Nearby Homes
- 26896 Park Terrace Ln Unit 229
- 27075 La Fuente
- 26848 Park Terrace Ln Unit 130
- 26732 Trasmiras
- 26611 Strafford
- 26972 Venado Dr
- 25 Winfield Dr
- 26466 San Torini Rd
- 27533 Calinda
- 26611 Loma Verde
- 26856 La Sierra Dr
- 78 Dawnwood
- 26646 Guadiana
- 33 Chadron Cir Unit 120
- 26635 Guadiana
- 42 Livingston Place
- 66 Garrison Loop
- 25 Garrison Loop
- 26914 Jasper Unit 254
- 26192 Golada
- 27462 Jasmine Ave Unit 209
- 27460 Jasmine Ave
- 27454 Jasmine Ave Unit 205
- 26982 Orchid Ave
- 27450 Jasmine Ave
- 27469 Jasmine Ave
- 27446 Jasmine Ave
- 27442 Jasmine Ave
- 27444 Jasmine Ave
- 27456 Jasmine Ave
- 27466 Jasmine Ave
- 27452 Jasmine Ave
- 27458 Jasmine Ave Unit 100
- 27458 Jasmine Ave
- 26969 Orchid Ave
- 27465 Jasmine Ave Unit 65
- 27471 Jasmine Ave Unit 62
- 26985 Orchid Ave
- 27468 Jasmine Ave
- 26967 Orchid Ave Unit 194