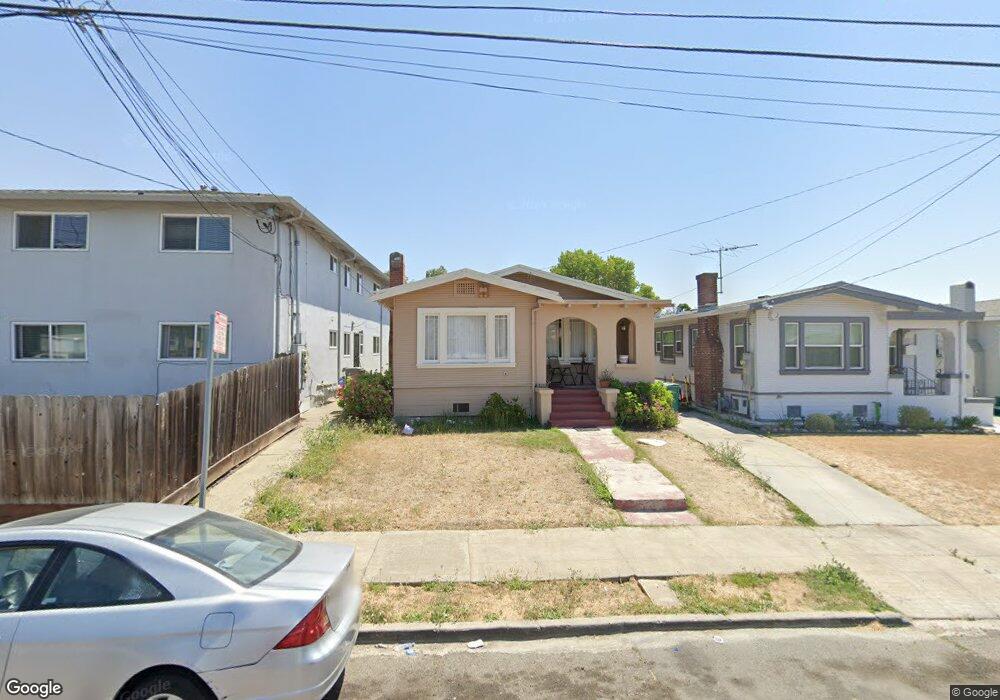
2750 79th Ave Oakland, CA 94605
Eastmont NeighborhoodEstimated Value: $408,000 - $511,000
2
Beds
1
Bath
1,152
Sq Ft
$407/Sq Ft
Est. Value
About This Home
This home is located at 2750 79th Ave, Oakland, CA 94605 and is currently estimated at $469,078, approximately $407 per square foot. 2750 79th Ave is a home located in Alameda County with nearby schools including Frick United Academy of Language, Coliseum College Prep Academy, and Madison Park Academy (6-12).
Ownership History
Date
Name
Owned For
Owner Type
Purchase Details
Closed on
Sep 17, 2018
Sold by
Lugo Carlos
Bought by
Lugo Carlos and Lugo Carmen
Current Estimated Value
Purchase Details
Closed on
Oct 15, 2015
Sold by
Oak Fund Llc
Bought by
Lugo Carlos
Purchase Details
Closed on
Oct 13, 2015
Sold by
Lugo Carmen
Bought by
Lugo Carlos
Purchase Details
Closed on
Oct 17, 2011
Sold by
Smith Terrence T and Estate Of Verdie Rose Smith
Bought by
Oak Fund Llc
Create a Home Valuation Report for This Property
The Home Valuation Report is an in-depth analysis detailing your home's value as well as a comparison with similar homes in the area
Home Values in the Area
Average Home Value in this Area
Purchase History
| Date | Buyer | Sale Price | Title Company |
|---|---|---|---|
| Lugo Carlos | -- | None Available | |
| Lugo Carlos | $250,000 | Old Republic Title Company | |
| Lugo Carlos | -- | Old Republic Title Company | |
| Oak Fund Llc | $101,500 | North American Title Company |
Source: Public Records
Tax History
| Year | Tax Paid | Tax Assessment Tax Assessment Total Assessment is a certain percentage of the fair market value that is determined by local assessors to be the total taxable value of land and additions on the property. | Land | Improvement |
|---|---|---|---|---|
| 2025 | $5,798 | $319,617 | $95,885 | $223,732 |
| 2024 | $5,798 | $313,350 | $94,005 | $219,345 |
| 2023 | $6,013 | $307,208 | $92,162 | $215,046 |
| 2022 | $5,815 | $301,184 | $90,355 | $210,829 |
| 2021 | $5,473 | $295,280 | $88,584 | $206,696 |
| 2020 | $5,413 | $292,253 | $87,676 | $204,577 |
| 2019 | $5,155 | $286,523 | $85,957 | $200,566 |
| 2018 | $5,051 | $280,907 | $84,272 | $196,635 |
| 2017 | $4,839 | $275,400 | $82,620 | $192,780 |
| 2016 | $4,627 | $270,000 | $81,000 | $189,000 |
| 2015 | $2,418 | $106,077 | $31,771 | $74,306 |
| 2014 | $2,341 | $103,999 | $31,148 | $72,851 |
Source: Public Records
Map
Nearby Homes
- 2714 79th Ave
- 2521 80th Ave
- 8016 Macarthur Blvd
- 7856 Garfield Ave
- 2740 76th Ave
- 8117 Ney Ave
- 3000 Partridge Ave
- 7700 Garfield Ave
- 8301 Macarthur Blvd
- 7807 Outlook Ave
- 2929 82nd Ave
- 7940 Bancroft Ave
- 2527 84th Ave
- 8311 Macarthur Blvd
- 2751 75th Ave
- 0 Bancroft Ave
- 3025 Partridge Ave
- 2612 75th Ave
- 2625 75th Ave
- 2522 75th Ave
Your Personal Tour Guide
Ask me questions while you tour the home.