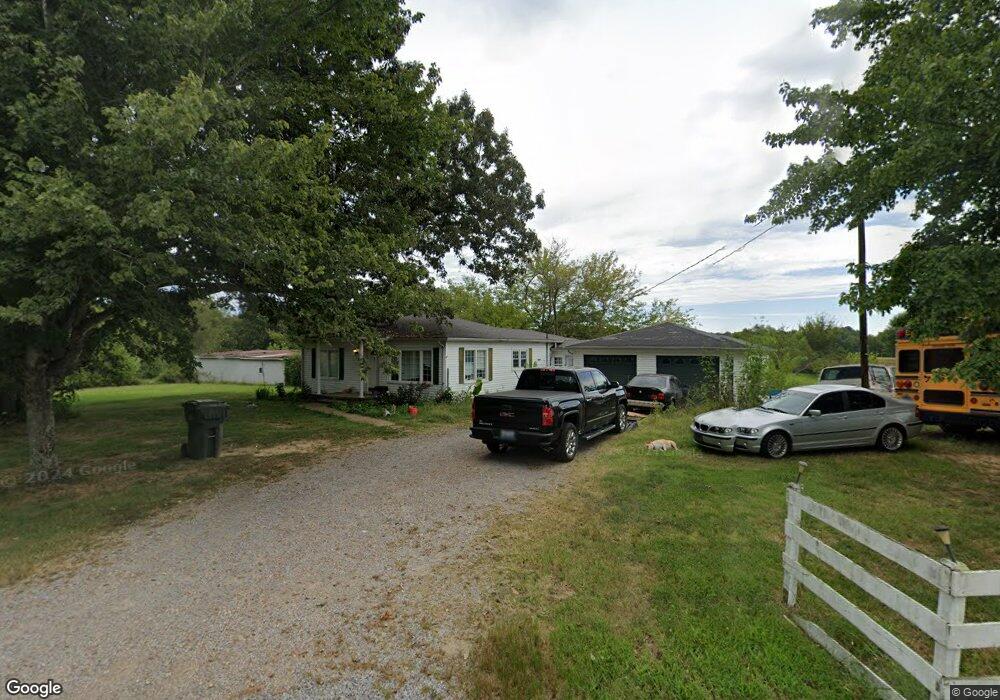
2750 Claytontown Rd Buchanan, TN 38222
Estimated Value: $161,000 - $225,000
--
Bed
1
Bath
1,239
Sq Ft
$159/Sq Ft
Est. Value
About This Home
This home is located at 2750 Claytontown Rd, Buchanan, TN 38222 and is currently estimated at $197,454, approximately $159 per square foot. 2750 Claytontown Rd is a home located in Henry County.
Ownership History
Date
Name
Owned For
Owner Type
Purchase Details
Closed on
Oct 22, 2020
Sold by
Mathis Cayce Jae
Bought by
Mathis Clarence Joseph Lee
Current Estimated Value
Purchase Details
Closed on
Nov 13, 2014
Sold by
Mills Dale D
Bought by
Mathis Clarence Joseph Lee and Mathis Cayce Jae
Home Financials for this Owner
Home Financials are based on the most recent Mortgage that was taken out on this home.
Original Mortgage
$66,750
Outstanding Balance
$51,133
Interest Rate
4%
Mortgage Type
Cash
Estimated Equity
$146,321
Purchase Details
Closed on
Aug 8, 2014
Sold by
Hall Irene Cummings
Bought by
Mills Dale D and Mills Esther
Purchase Details
Closed on
Jun 17, 2004
Sold by
Mercer Thomas W
Bought by
Dwight Mercer
Purchase Details
Closed on
Jul 6, 1999
Sold by
John Mcnutt and John Cindy
Bought by
Jonathan Baker and Jonathan Tifani
Purchase Details
Closed on
Jun 17, 1998
Sold by
Mrs Stark Martha
Bought by
John Mcnutt and John Cindy
Purchase Details
Closed on
Dec 28, 1955
Bought by
Stark Martha Mrs
Create a Home Valuation Report for This Property
The Home Valuation Report is an in-depth analysis detailing your home's value as well as a comparison with similar homes in the area
Home Values in the Area
Average Home Value in this Area
Purchase History
| Date | Buyer | Sale Price | Title Company |
|---|---|---|---|
| Mathis Clarence Joseph Lee | -- | None Available | |
| Mathis Clarence Joseph Lee | $75,000 | -- | |
| Mills Dale D | $19,350 | -- | |
| Dwight Mercer | -- | -- | |
| Mercer Thomas W | $107,000 | -- | |
| Relocation Sirva | $107,000 | -- | |
| Jonathan Baker | $87,500 | -- | |
| John Mcnutt | $2,000 | -- | |
| Stark Martha Mrs | -- | -- |
Source: Public Records
Mortgage History
| Date | Status | Borrower | Loan Amount |
|---|---|---|---|
| Open | Mathis Clarence Joseph Lee | $66,750 |
Source: Public Records
Tax History Compared to Growth
Tax History
| Year | Tax Paid | Tax Assessment Tax Assessment Total Assessment is a certain percentage of the fair market value that is determined by local assessors to be the total taxable value of land and additions on the property. | Land | Improvement |
|---|---|---|---|---|
| 2024 | $487 | $25,175 | $8,075 | $17,100 |
| 2023 | $477 | $25,175 | $8,075 | $17,100 |
| 2022 | $477 | $25,175 | $8,075 | $17,100 |
| 2021 | $477 | $25,175 | $8,075 | $17,100 |
| 2020 | $477 | $25,175 | $8,075 | $17,100 |
| 2019 | $441 | $21,075 | $5,125 | $15,950 |
| 2018 | $441 | $21,075 | $5,125 | $15,950 |
| 2017 | $441 | $21,075 | $5,125 | $15,950 |
| 2016 | $435 | $21,075 | $5,125 | $15,950 |
| 2015 | $463 | $21,075 | $5,125 | $15,950 |
| 2014 | $507 | $21,075 | $5,125 | $15,950 |
| 2013 | $507 | $23,090 | $0 | $0 |
Source: Public Records
Map
Nearby Homes
- 000 Mount Sinai Rd
- 0 Conbanna S D Unit 134480
- 10433 Shady Grove Rd
- 2794 Perkins Rd
- 9780 Highway 140 E
- 8985 Shady Grove Rd
- 5570 New Providence Rd
- 1230 Perkins Rd
- 2110 Red Top Hill Rd
- 0 Perkins Rd
- 00 Perkins Rd
- 000 Perkins Rd
- 0 Cay Lawrence Rd
- 9780 Hwy 140 E
- 5340 Rabbit Creek Rd
- 7 Christian Ln
- 101 Christian Ln
- 000 Robert Barnhill Rd
- 715 Shoemaker Rd
- 00 Atkins Trail
- 2750 Clayton Town Rd
- 2664 Claytontown Rd
- 66 Blood River Church Rd
- 114 Blood River Church Rd
- 180 Blood River Church Rd
- 2430 Claytontown Rd
- 3103 Claytontown Rd
- 910 Blood River Church Rd
- 450 Blood River Church Rd
- 2355 Claytontown Rd
- 3185 Claytontown Rd
- 2375 Claytontown Rd
- 2325 Clayton Town Rd
- 2325 Claytontown Rd
- 601 McGhee Branch Ln
- 400 McGhee Branch Ln
- 2305 Claytontown Rd
- 2135 Claytontown Rd
- 840 McGhee Branch Rd
- 1085 Dale Cemetery Rd