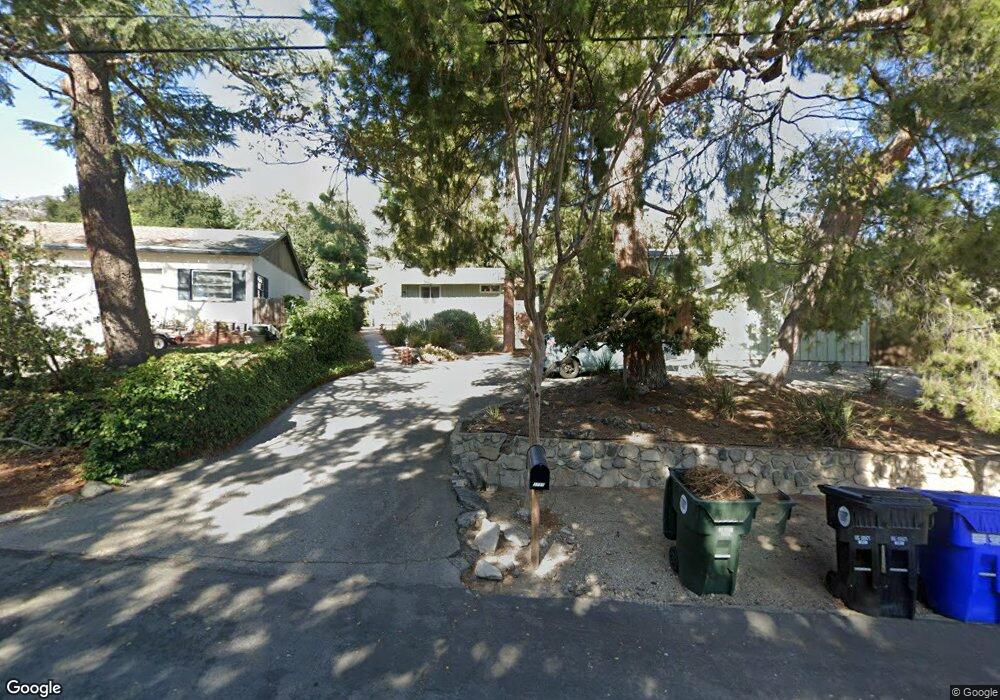
2751 Henrietta Ave La Crescenta, CA 91214
Estimated Value: $1,581,000 - $1,778,616
3
Beds
2
Baths
1,821
Sq Ft
$928/Sq Ft
Est. Value
About This Home
This home is located at 2751 Henrietta Ave, La Crescenta, CA 91214 and is currently estimated at $1,689,404, approximately $927 per square foot. 2751 Henrietta Ave is a home located in Los Angeles County with nearby schools including Monte Vista Elementary School, Rosemont Middle School, and Crescenta Valley High School.
Ownership History
Date
Name
Owned For
Owner Type
Purchase Details
Closed on
May 17, 2024
Sold by
Franck Stephan A and Franck Christina
Bought by
Franck Family Trust and Franck
Current Estimated Value
Purchase Details
Closed on
Oct 10, 2005
Sold by
Franck Stephan A
Bought by
Franck Stephan A and Franck Christina
Home Financials for this Owner
Home Financials are based on the most recent Mortgage that was taken out on this home.
Original Mortgage
$636,000
Interest Rate
5.67%
Mortgage Type
New Conventional
Purchase Details
Closed on
Jun 11, 1998
Sold by
Wood Janet L
Bought by
Franck Stephanie A and Franck Christina
Home Financials for this Owner
Home Financials are based on the most recent Mortgage that was taken out on this home.
Original Mortgage
$374,400
Interest Rate
6.9%
Create a Home Valuation Report for This Property
The Home Valuation Report is an in-depth analysis detailing your home's value as well as a comparison with similar homes in the area
Home Values in the Area
Average Home Value in this Area
Purchase History
| Date | Buyer | Sale Price | Title Company |
|---|---|---|---|
| Franck Family Trust | -- | None Listed On Document | |
| Franck Stephan A | -- | United Title Company Ventura | |
| Franck Stephanie A | $416,000 | Old Republic Title |
Source: Public Records
Mortgage History
| Date | Status | Borrower | Loan Amount |
|---|---|---|---|
| Previous Owner | Franck Stephan A | $636,000 | |
| Previous Owner | Franck Stephanie A | $374,400 |
Source: Public Records
Tax History
| Year | Tax Paid | Tax Assessment Tax Assessment Total Assessment is a certain percentage of the fair market value that is determined by local assessors to be the total taxable value of land and additions on the property. | Land | Improvement |
|---|---|---|---|---|
| 2025 | $9,122 | $786,649 | $407,597 | $379,052 |
| 2024 | $9,122 | $771,225 | $399,605 | $371,620 |
| 2023 | $8,825 | $756,104 | $391,770 | $364,334 |
| 2022 | $8,481 | $741,280 | $384,089 | $357,191 |
| 2021 | $8,330 | $726,746 | $376,558 | $350,188 |
| 2019 | $8,015 | $705,192 | $365,390 | $339,802 |
| 2018 | $7,850 | $691,366 | $358,226 | $333,140 |
| 2016 | $7,481 | $664,520 | $344,316 | $320,204 |
| 2015 | $7,322 | $654,540 | $339,145 | $315,395 |
| 2014 | $7,264 | $641,719 | $332,502 | $309,217 |
Source: Public Records
Map
Nearby Homes
- 4930 Ramsdell Ave
- 2902 El Caminito
- 2758 El Caminito
- 2507 Rockdell St
- 3041 Alabama St
- 2472 Shields St
- 3011 Frances Ave
- 3908 Park Place
- 2423 Rockdell St
- 2620 Sea Pine Ln
- 3033 Fairesta St
- 3129 Orange Ave
- 2443 Shields St
- 2430 Orange Ave
- 4608 La Crescenta Ave
- 2829 Willowhaven Dr
- 2307 Dorothy St
- 5431 Ocean View Blvd
- 4210 New York Ave
- 5481 Ocean View Blvd
- 2747 Henrietta Ave
- 2789 Henrietta Ave
- 2757 Henrietta Ave
- 2745 Henrietta Ave
- 2734 Frances Ave
- 2740 Frances Ave
- 5104 La Crescenta Ave
- 2730 Frances Ave
- 2735 Henrietta Ave
- 2754 Henrietta Ave
- 2758 Henrietta Ave
- 2746 Frances Ave
- 2748 Henrietta Ave
- 2748 Frances Ave
- 2728 Frances Ave
- 2742 Henrietta Ave
- 5110 La Crescenta Ave
- 2736 Henrietta Ave
- 2752 Frances Ave
- 2731 Henrietta Ave
Your Personal Tour Guide
Ask me questions while you tour the home.