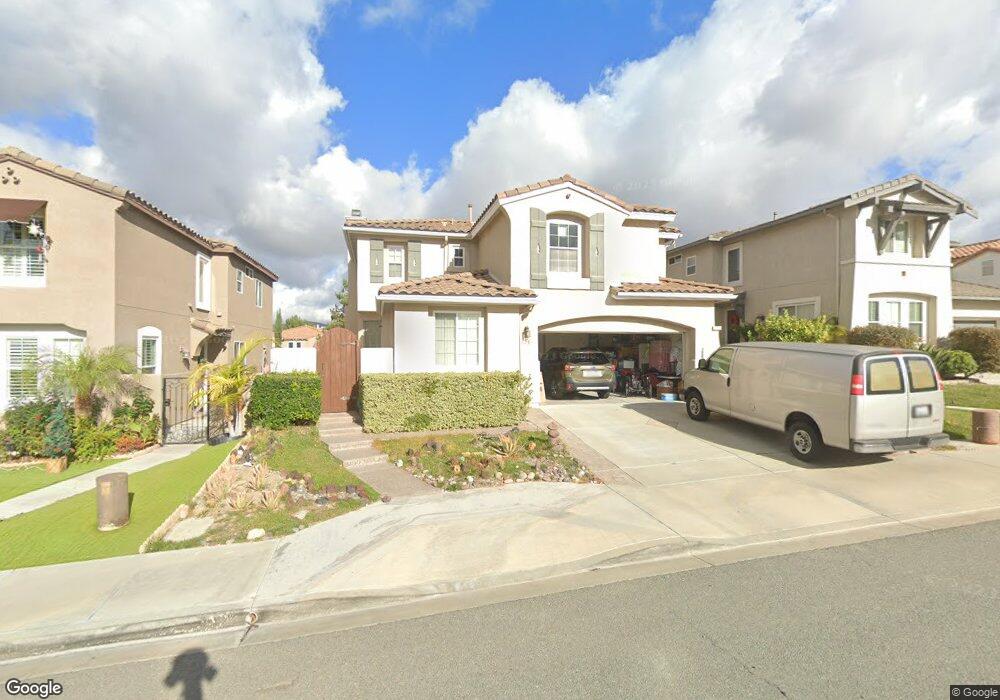
2751 Red Rock Canyon Rd Chula Vista, CA 91915
Eastlake NeighborhoodEstimated Value: $914,414 - $967,000
3
Beds
3
Baths
1,881
Sq Ft
$498/Sq Ft
Est. Value
About This Home
This home is located at 2751 Red Rock Canyon Rd, Chula Vista, CA 91915 and is currently estimated at $936,354, approximately $497 per square foot. 2751 Red Rock Canyon Rd is a home located in San Diego County with nearby schools including Salt Creek Elementary School, Eastlake Middle School, and Eastlake High School.
Ownership History
Date
Name
Owned For
Owner Type
Purchase Details
Closed on
Jan 27, 2012
Sold by
Castorena Raul and Viramontes Castorena Vikki
Bought by
Pak Hae Young
Current Estimated Value
Home Financials for this Owner
Home Financials are based on the most recent Mortgage that was taken out on this home.
Original Mortgage
$192,000
Outstanding Balance
$140,485
Interest Rate
5.37%
Mortgage Type
New Conventional
Estimated Equity
$795,869
Purchase Details
Closed on
Sep 28, 2009
Sold by
Castorena Raul and Viramontes Castorena Vikki
Bought by
Castorena Raul and Viramontes Castorena Vikki
Purchase Details
Closed on
Apr 1, 2005
Sold by
Monticello At Eastlake Lp
Bought by
Castorena Raul and Viramontes Castorena Vikki
Home Financials for this Owner
Home Financials are based on the most recent Mortgage that was taken out on this home.
Original Mortgage
$489,550
Interest Rate
5.25%
Mortgage Type
Fannie Mae Freddie Mac
Create a Home Valuation Report for This Property
The Home Valuation Report is an in-depth analysis detailing your home's value as well as a comparison with similar homes in the area
Home Values in the Area
Average Home Value in this Area
Purchase History
| Date | Buyer | Sale Price | Title Company |
|---|---|---|---|
| Pak Hae Young | $320,000 | Old Republic Title Company | |
| Pak Hae Young | -- | Old Republic Title Company | |
| Castorena Raul | -- | None Available | |
| Castorena Raul | $612,000 | First American Title |
Source: Public Records
Mortgage History
| Date | Status | Borrower | Loan Amount |
|---|---|---|---|
| Open | Pak Hae Young | $192,000 | |
| Previous Owner | Castorena Raul | $489,550 |
Source: Public Records
Tax History Compared to Growth
Tax History
| Year | Tax Paid | Tax Assessment Tax Assessment Total Assessment is a certain percentage of the fair market value that is determined by local assessors to be the total taxable value of land and additions on the property. | Land | Improvement |
|---|---|---|---|---|
| 2025 | $6,643 | $401,923 | $238,643 | $163,280 |
| 2024 | $6,643 | $394,043 | $233,964 | $160,079 |
| 2023 | $6,627 | $386,318 | $229,377 | $156,941 |
| 2022 | $6,444 | $378,744 | $224,880 | $153,864 |
| 2021 | $6,314 | $371,319 | $220,471 | $150,848 |
| 2020 | $6,180 | $367,513 | $218,211 | $149,302 |
| 2019 | $6,039 | $360,308 | $213,933 | $146,375 |
| 2018 | $5,951 | $353,244 | $209,739 | $143,505 |
| 2017 | $5,850 | $346,319 | $205,627 | $140,692 |
| 2016 | $5,645 | $339,530 | $201,596 | $137,934 |
| 2015 | $5,536 | $334,431 | $198,568 | $135,863 |
| 2014 | $5,508 | $327,881 | $194,679 | $133,202 |
Source: Public Records
Map
Nearby Homes
- 1427 Marble Canyon Way
- 2744 Rambling Vista Rd
- 1436 Horn Canyon Ave
- 2792 Rambling Vista Rd
- 2814 Rambling Vista Rd
- 1461 Agate Creek Way
- 2832 Echo Ridge Ct
- 1505 Laurel Grove Dr Unit 3
- 2796 Bear Valley Rd
- 2721 Castlehill Rd Unit 1
- 1328 N Paradise Ridge Way
- 2816 Weeping Willow Rd
- 2754 Silver Medal Rd Unit 1
- 2850 Palmetto Point Ct
- 2993 Weeping Willow Rd
- 2710 Sparta Rd Unit 10
- 1515 Crown Ln Unit 6
- 2710 Apricot Ct
- 1512 Champion Ln Unit 4
- 2770 Sparta Rd Unit 14
- 2755 Red Rock Canyon Rd
- 2747 Red Rock Canyon Rd
- 2743 Red Rock Canyon Rd
- 2759 Red Rock Canyon Rd
- 2748 Red Rock Canyon Rd
- 2739 Red Rock Canyon Rd
- 2763 Red Rock Canyon Rd
- 2760 Red Rock Canyon Rd
- 2744 Red Rock Canyon Rd
- 2768 Red Rock Canyon Rd
- 2740 Red Rock Canyon Rd
- 1410 Yellowstone Ave
- 2767 Red Rock Canyon Rd
- 2735 Red Rock Canyon Rd
- 2752 Rambling Vista Rd
- 2756 Rambling Vista Rd
- 2748 Rambling Vista Rd
- 1411 Yellowstone Ave
- 2760 Rambling Vista Rd
- 1419 Marble Canyon Way