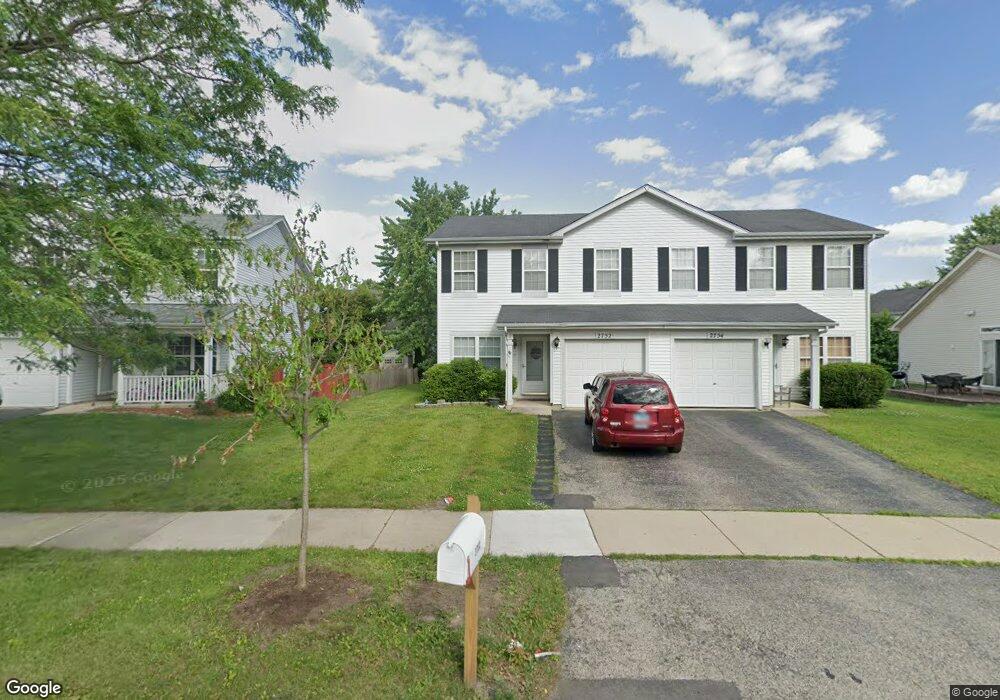
2752 Cedar Glade Rd Unit 3 Naperville, IL 60564
Wood Lake NeighborhoodEstimated Value: $338,000 - $369,591
3
Beds
3
Baths
1,502
Sq Ft
$236/Sq Ft
Est. Value
About This Home
This home is located at 2752 Cedar Glade Rd Unit 3, Naperville, IL 60564 and is currently estimated at $354,898, approximately $236 per square foot. 2752 Cedar Glade Rd Unit 3 is a home located in Will County with nearby schools including Welch Elementary School, Scullen Middle School, and Neuqua Valley High School.
Ownership History
Date
Name
Owned For
Owner Type
Purchase Details
Closed on
Mar 28, 2012
Sold by
Aja Maureen and Aja Marcum
Bought by
Jie Quian and Shen Ying
Current Estimated Value
Home Financials for this Owner
Home Financials are based on the most recent Mortgage that was taken out on this home.
Original Mortgage
$107,250
Interest Rate
3.64%
Mortgage Type
New Conventional
Purchase Details
Closed on
Sep 25, 2002
Sold by
Eamon Gail S
Bought by
Aja Maureen
Home Financials for this Owner
Home Financials are based on the most recent Mortgage that was taken out on this home.
Original Mortgage
$164,290
Interest Rate
6.34%
Purchase Details
Closed on
May 7, 1998
Sold by
Woodlake Ltd Partnership
Bought by
Eamon Gail S
Home Financials for this Owner
Home Financials are based on the most recent Mortgage that was taken out on this home.
Original Mortgage
$96,500
Interest Rate
7.27%
Create a Home Valuation Report for This Property
The Home Valuation Report is an in-depth analysis detailing your home's value as well as a comparison with similar homes in the area
Home Values in the Area
Average Home Value in this Area
Purchase History
| Date | Buyer | Sale Price | Title Company |
|---|---|---|---|
| Jie Quian | $143,000 | Chicago Title Insurance Co | |
| Aja Maureen | $167,500 | Burnet Title Llc | |
| Eamon Gail S | $121,000 | Chicago Title Insurance Co |
Source: Public Records
Mortgage History
| Date | Status | Borrower | Loan Amount |
|---|---|---|---|
| Previous Owner | Jie Quian | $107,250 | |
| Previous Owner | Aja Maureen | $164,290 | |
| Previous Owner | Eamon Gail S | $96,500 |
Source: Public Records
Tax History Compared to Growth
Tax History
| Year | Tax Paid | Tax Assessment Tax Assessment Total Assessment is a certain percentage of the fair market value that is determined by local assessors to be the total taxable value of land and additions on the property. | Land | Improvement |
|---|---|---|---|---|
| 2024 | $6,471 | $98,793 | $29,956 | $68,837 |
| 2023 | $6,471 | $87,273 | $26,463 | $60,810 |
| 2022 | $5,668 | $78,224 | $25,034 | $53,190 |
| 2021 | $5,427 | $74,499 | $23,842 | $50,657 |
| 2020 | $5,327 | $73,318 | $23,464 | $49,854 |
| 2019 | $5,241 | $71,252 | $22,803 | $48,449 |
| 2018 | $4,877 | $65,106 | $22,302 | $42,804 |
| 2017 | $4,808 | $63,425 | $21,726 | $41,699 |
| 2016 | $4,803 | $62,059 | $21,258 | $40,801 |
| 2015 | $4,045 | $59,672 | $20,440 | $39,232 |
| 2014 | $4,045 | $55,179 | $20,440 | $34,739 |
| 2013 | $4,045 | $62,834 | $20,440 | $42,394 |
Source: Public Records
Map
Nearby Homes
- 2850 Stonewater Dr Unit 92
- 2866 Stonewater Dr Unit 102
- 2611 Cedar Glade Dr Unit 204
- 2511 Sheehan Dr Unit 203
- 2652 Charlestowne Ln
- 2736 Bluewater Cir
- 2543 Dewes Ln
- 3311 Fairmont Ave
- 3349 Rosecroft Ln Unit 2
- 2207 Sisters Ave
- 3003 Kingbird Ct Unit IV
- 3408 Parliament Ln Unit 1
- 2220 Waterleaf Ct Unit 204
- 3281 Cool Springs Ct
- 3316 Club Ct
- 2949 Brossman St
- 2636 Salix Cir
- 28W555 Leverenz Rd
- 3707 Junebreeze Ln
- 2819 Normandy Cir
- 2754 Cedar Glade Rd
- 2748 Cedar Glade Rd Unit 3
- 2746 Cedar Glade Rd
- 2758 Cedar Glade Rd
- 2591 Warm Springs Ln
- 2589 Warm Springs Ln
- 2593 Warm Springs Ln
- 2760 Cedar Glade Rd Unit 3
- 2742 Cedar Glade Rd
- 2587 Warm Springs Ln
- 2727 Idaho Rd
- 2764 Cedar Glade Rd
- 2581 Warm Springs Ln
- 2740 Cedar Glade Rd
- 2729 Idaho Rd
- 2723 Idaho Rd
- 2751 Cedar Glade Rd
- 2751 Cedar Glade Rd Unit 1
- 2766 Cedar Glade Dr
- 2753 Cedar Glade Rd