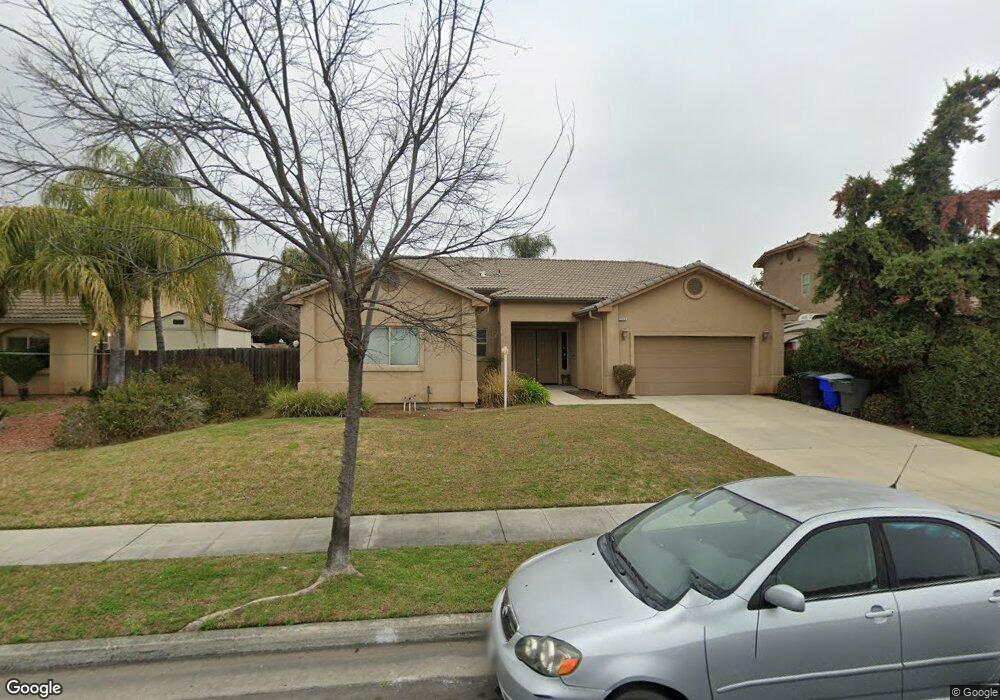
2752 Florence Ave Sanger, CA 93657
Estimated Value: $439,093 - $498,000
3
Beds
3
Baths
2,070
Sq Ft
$227/Sq Ft
Est. Value
About This Home
This home is located at 2752 Florence Ave, Sanger, CA 93657 and is currently estimated at $470,773, approximately $227 per square foot. 2752 Florence Ave is a home located in Fresno County with nearby schools including Reagan Elementary School, Washington Academic Middle School, and Sanger High School.
Ownership History
Date
Name
Owned For
Owner Type
Purchase Details
Closed on
Aug 18, 2014
Sold by
Fiserv Iss & Co
Bought by
Pensco Trust Company
Current Estimated Value
Purchase Details
Closed on
Jul 19, 2010
Sold by
37 Stonehaven Llc
Bought by
La Silla Investments Inc
Purchase Details
Closed on
Jul 31, 2008
Sold by
Borba Robert J and Stinchfield Financial Servgice
Bought by
37 Stonehaven Llc
Purchase Details
Closed on
Nov 8, 2007
Sold by
Charnley Land Inc
Bought by
Borba Robert J and The Stinchfield Financial Serv
Purchase Details
Closed on
Mar 8, 2006
Sold by
Sanger Ii Ca Llc
Bought by
Charnley Land Inc
Home Financials for this Owner
Home Financials are based on the most recent Mortgage that was taken out on this home.
Original Mortgage
$292,000
Interest Rate
6.25%
Mortgage Type
Construction
Create a Home Valuation Report for This Property
The Home Valuation Report is an in-depth analysis detailing your home's value as well as a comparison with similar homes in the area
Home Values in the Area
Average Home Value in this Area
Purchase History
We collect this data history from publicly available records. To have your information removed, we recommend requesting removal directly through your county’s website.
| Date | Buyer | Sale Price | Title Company |
|---|---|---|---|
| Pensco Trust Company | -- | None Available | |
| La Silla Investments Inc | $175,000 | First American Title Company | |
| 37 Stonehaven Llc | -- | None Available | |
| Borba Robert J | $321,170 | United Title Company | |
| Charnley Land Inc | $700,000 | Chicago Title Company |
Source: Public Records
Mortgage History
We collect this data history from publicly available records. To have your information removed, we recommend requesting removal directly through your county’s website.
| Date | Status | Borrower | Loan Amount |
|---|---|---|---|
| Previous Owner | Charnley Land Inc | $292,000 |
Source: Public Records
Tax History
| Year | Tax Paid | Tax Assessment Tax Assessment Total Assessment is a certain percentage of the fair market value that is determined by local assessors to be the total taxable value of land and additions on the property. | Land | Improvement |
|---|---|---|---|---|
| 2025 | $3,674 | $224,192 | $51,240 | $172,952 |
| 2023 | $3,448 | $215,488 | $49,251 | $166,237 |
| 2022 | $3,309 | $211,264 | $48,286 | $162,978 |
| 2021 | $3,288 | $207,123 | $47,340 | $159,783 |
| 2020 | $3,152 | $205,000 | $46,855 | $158,145 |
| 2019 | $3,101 | $200,982 | $45,937 | $155,045 |
| 2018 | $3,015 | $197,042 | $45,037 | $152,005 |
| 2017 | $2,958 | $193,179 | $44,154 | $149,025 |
| 2016 | $2,817 | $189,392 | $43,289 | $146,103 |
| 2015 | $2,835 | $186,548 | $42,639 | $143,909 |
| 2014 | $2,791 | $182,895 | $41,804 | $141,091 |
Source: Public Records
Map
Nearby Homes
- 2852 Geary Ave
- 45 Lyon Ave
- 371 Bethel Ave Unit 129
- 371 Bethel Ave Unit 74
- 371 Bethel Ave
- 371 Bethel Ave Unit 88
- 371 Bethel Ave Unit 24
- 371 Bethel Ave Unit 70
- 371 Bethel Ave Unit 27
- 371 Bethel Ave Unit 55
- 2153 Jenni Ave
- 2160 3rd St
- 201 Hill Ave
- 1745 N Bethel Ave
- 805 Lyon Ave
- 509 West Ave
- 877 Sandra Ave
- 0 N Academy Ave
- 1 Indianola Ave
- 521 O St
- 2734 Florence Ave
- 2741 Geary Ave
- 2725 Geary Ave
- 2690 Florence Ave
- 2759 Geary Ave
- 2768 Florence Ave
- 2733 Florence Ave
- 2775 Geary Ave
- 2751 Florence Ave
- 2699 Florence Ave
- 20 N Lily Ave
- 2784 Florence Ave
- 2670 Florence Ave
- 2734 Geary Ave
- 2767 Florence Ave
- 2752 Geary Ave
- 40 N Lily Ave
- 2791 Geary Ave
- 2744 Sequoia Ave
- 2728 Sequoia Ave
Your Personal Tour Guide
Ask me questions while you tour the home.