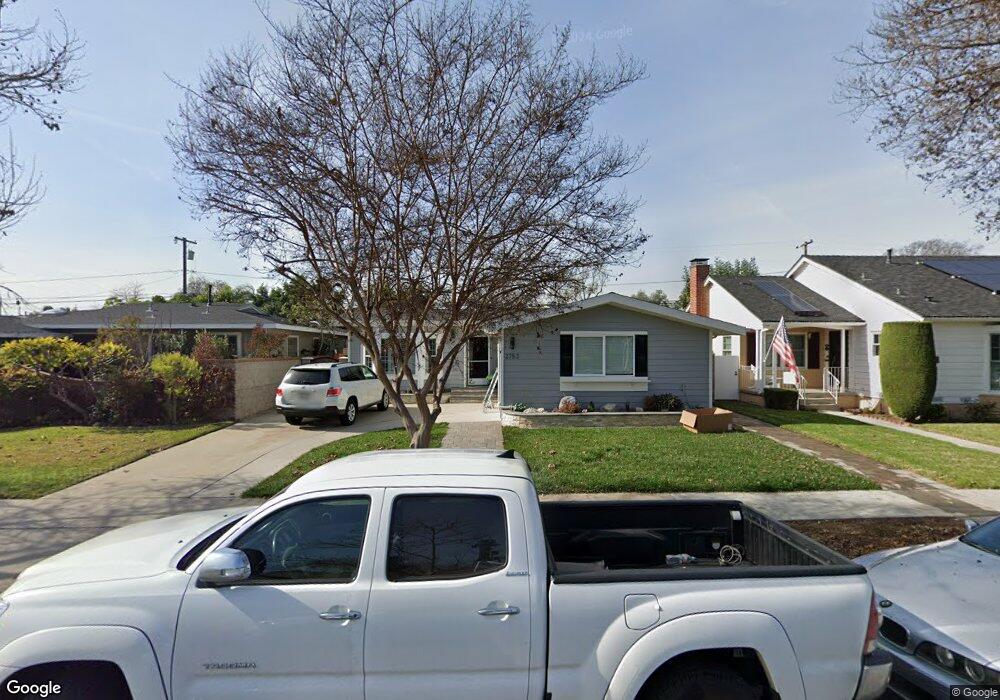
2753 Josie Ave Long Beach, CA 90815
El Dorado Park NeighborhoodEstimated Value: $982,000 - $1,130,000
2
Beds
2
Baths
1,394
Sq Ft
$751/Sq Ft
Est. Value
About This Home
This home is located at 2753 Josie Ave, Long Beach, CA 90815 and is currently estimated at $1,046,939, approximately $751 per square foot. 2753 Josie Ave is a home located in Los Angeles County with nearby schools including Stanford Middle School, Millikan High School, and Los Altos Grace Schools.
Ownership History
Date
Name
Owned For
Owner Type
Purchase Details
Closed on
Sep 14, 2009
Sold by
Tuck Chad Taylor and Tuck Lisa T
Bought by
Tuck Chad T
Current Estimated Value
Purchase Details
Closed on
Oct 10, 2000
Sold by
Breitung Leona J and The John W & Leona J Breitung
Bought by
Tuck Chad Taylor
Home Financials for this Owner
Home Financials are based on the most recent Mortgage that was taken out on this home.
Original Mortgage
$230,800
Outstanding Balance
$83,929
Interest Rate
7.88%
Estimated Equity
$963,010
Purchase Details
Closed on
Feb 22, 1994
Sold by
Breitung John W and Breitung Leona J
Bought by
Breitung John W
Purchase Details
Closed on
Aug 26, 1993
Sold by
Breitung John W and Breitung Leona J
Bought by
Breitung John W
Home Financials for this Owner
Home Financials are based on the most recent Mortgage that was taken out on this home.
Original Mortgage
$111,000
Interest Rate
7.2%
Create a Home Valuation Report for This Property
The Home Valuation Report is an in-depth analysis detailing your home's value as well as a comparison with similar homes in the area
Home Values in the Area
Average Home Value in this Area
Purchase History
| Date | Buyer | Sale Price | Title Company |
|---|---|---|---|
| Tuck Chad T | -- | None Available | |
| Tuck Chad Taylor | $288,500 | Lawyers Title | |
| Breitung John W | -- | -- | |
| Breitung John W | -- | -- | |
| Breitung John W | -- | South Coast Title Company |
Source: Public Records
Mortgage History
| Date | Status | Borrower | Loan Amount |
|---|---|---|---|
| Open | Tuck Chad Taylor | $230,800 | |
| Previous Owner | Breitung John W | $111,000 | |
| Closed | Tuck Chad Taylor | $43,275 |
Source: Public Records
Tax History Compared to Growth
Tax History
| Year | Tax Paid | Tax Assessment Tax Assessment Total Assessment is a certain percentage of the fair market value that is determined by local assessors to be the total taxable value of land and additions on the property. | Land | Improvement |
|---|---|---|---|---|
| 2025 | $6,184 | $483,834 | $291,262 | $192,572 |
| 2024 | $6,184 | $474,348 | $285,551 | $188,797 |
| 2023 | $6,086 | $465,048 | $279,952 | $185,096 |
| 2022 | $5,717 | $455,930 | $274,463 | $181,467 |
| 2021 | $5,608 | $446,991 | $269,082 | $177,909 |
| 2019 | $5,524 | $433,734 | $261,101 | $172,633 |
| 2018 | $5,308 | $425,231 | $255,982 | $169,249 |
| 2016 | $4,875 | $408,721 | $246,043 | $162,678 |
| 2015 | $4,678 | $402,583 | $242,348 | $160,235 |
| 2014 | $4,644 | $354,617 | $237,601 | $117,016 |
Source: Public Records
Map
Nearby Homes
- 2725 Ladoga Ave
- 6361 E Deborah St
- 2729 N Studebaker Rd
- 3032 Ostrom Ave
- 2670 Gondar Ave
- 6241 E Vernon St
- 6110 E Walton St
- 2690 Senasac Ave
- 2440 Ostrom Ave
- 6449 E Los Arcos St
- 2541 Gondar Ave
- 6266 E Metz St
- 2660 San Vicente Ave
- 5865 E Rogene St
- 2360 Fanwood Ave
- 5845 E Deborah St
- 7108 E Mezzanine Way
- 3333 N Los Coyotes Diagonal
- 3203 Faust Ave
- 3350 N Studebaker Rd
- 2747 Josie Ave
- 2757 Josie Ave
- 2746 Iroquois Ave
- 2741 Josie Ave
- 2763 Josie Ave
- 2740 Iroquois Ave
- 2750 Iroquois Ave
- 2734 Iroquois Ave
- 2756 Iroquois Ave
- 2750 Josie Ave
- 2735 Josie Ave
- 2803 Josie Ave
- 2754 Josie Ave
- 2744 Josie Ave
- 2728 Iroquois Ave
- 2738 Josie Ave
- 2731 Josie Ave
- 2809 Josie Ave
- 2734 Josie Ave