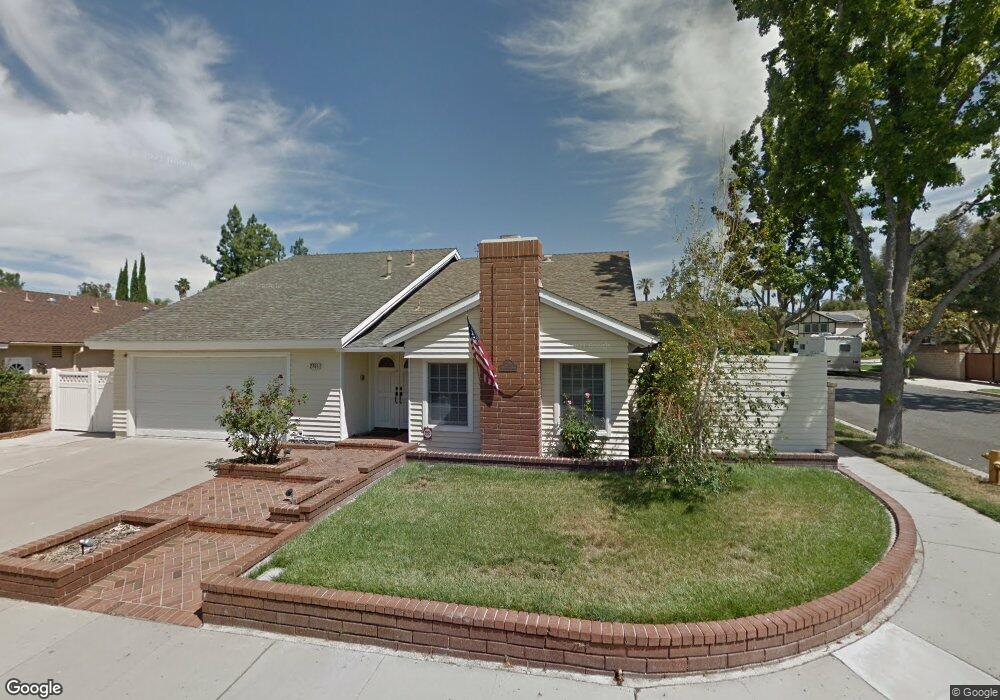
2761 Wheatfield Cir Simi Valley, CA 93063
Central Simi Valley NeighborhoodEstimated Value: $900,000 - $1,026,000
4
Beds
2
Baths
1,988
Sq Ft
$479/Sq Ft
Est. Value
About This Home
This home is located at 2761 Wheatfield Cir, Simi Valley, CA 93063 and is currently estimated at $952,019, approximately $478 per square foot. 2761 Wheatfield Cir is a home located in Ventura County with nearby schools including Garden Grove Elementary School, Valley View Middle School, and Simi Valley High School.
Ownership History
Date
Name
Owned For
Owner Type
Purchase Details
Closed on
Sep 5, 2011
Sold by
Bengler Gary W and Bengler Carolyn Adams
Bought by
Bengler Gary W and Bengler Carolyn A
Current Estimated Value
Purchase Details
Closed on
Nov 28, 2007
Sold by
Bengler Gary W
Bought by
Bengler Gary W and Bengler Carolyn Adams
Home Financials for this Owner
Home Financials are based on the most recent Mortgage that was taken out on this home.
Original Mortgage
$93,000
Interest Rate
6.3%
Mortgage Type
New Conventional
Purchase Details
Closed on
Jun 4, 1998
Sold by
Barbara Bengler
Bought by
Bengler Gary W
Home Financials for this Owner
Home Financials are based on the most recent Mortgage that was taken out on this home.
Original Mortgage
$95,000
Interest Rate
7.17%
Create a Home Valuation Report for This Property
The Home Valuation Report is an in-depth analysis detailing your home's value as well as a comparison with similar homes in the area
Home Values in the Area
Average Home Value in this Area
Purchase History
| Date | Buyer | Sale Price | Title Company |
|---|---|---|---|
| Bengler Gary W | -- | None Available | |
| Bengler Gary W | -- | Fidelity National Title Co | |
| Bengler Gary W | -- | Chicago Title Co |
Source: Public Records
Mortgage History
| Date | Status | Borrower | Loan Amount |
|---|---|---|---|
| Closed | Bengler Gary W | $93,000 | |
| Closed | Bengler Gary W | $95,000 |
Source: Public Records
Tax History
| Year | Tax Paid | Tax Assessment Tax Assessment Total Assessment is a certain percentage of the fair market value that is determined by local assessors to be the total taxable value of land and additions on the property. | Land | Improvement |
|---|---|---|---|---|
| 2025 | $3,700 | $258,252 | $61,784 | $196,468 |
| 2024 | $3,700 | $253,189 | $60,573 | $192,616 |
| 2023 | $3,488 | $248,225 | $59,385 | $188,840 |
| 2022 | $3,453 | $243,358 | $58,220 | $185,138 |
| 2021 | $3,408 | $238,587 | $57,079 | $181,508 |
| 2020 | $3,328 | $236,143 | $56,495 | $179,648 |
| 2019 | $3,183 | $231,514 | $55,388 | $176,126 |
| 2018 | $3,144 | $226,975 | $54,302 | $172,673 |
| 2017 | $3,068 | $222,526 | $53,238 | $169,288 |
| 2016 | $2,934 | $218,164 | $52,195 | $165,969 |
| 2015 | $2,866 | $214,889 | $51,412 | $163,477 |
| 2014 | $2,816 | $210,682 | $50,406 | $160,276 |
Source: Public Records
Map
Nearby Homes
- 2746 Lemon Dr
- 3445 Highwood Ct Unit 128
- 3474 Highwood Ct Unit 80
- 3434 Highwood Ct Unit 183
- 3458 Highwood Ct Unit 198
- 3403 Highwood Ct Unit 154
- 2413 Lita Place
- 3550 Woodhaven St
- 2972 Ivory Ave
- 3279 Avenida Simi
- 6505 Canyon Oaks Dr
- 3354 Darby St Unit 313
- 2707 Bitternut Cir
- 3264 Darby St Unit 142
- 3210 Darby St Unit 102
- 3370 Township Ave
- 3330 Township Ave
- 3028 Harrison Ln
- 2362 Medina Ave
- 2358 Medina Ave
- 2755 Wheatfield Cir
- 2789 Goldfield Place
- 2791 Goldfield Place
- 2751 Wheatfield Cir
- 2765 Wheatfield Cir
- 2760 Wheatfield Cir
- 2754 Wheatfield Cir
- 2766 Wheatfield Cir
- 2793 Goldfield Place
- 2745 Wheatfield Cir
- 2780 Goldfield Place
- 2771 Wheatfield Cir
- 2750 Wheatfield Cir
- 2762 Goldfield Place
- 2772 Wheatfield Cir
- 2751 Goldfield Place
- 2786 Goldfield Place
- 2741 Wheatfield Cir
- 2744 Wheatfield Cir
- 2775 Wheatfield Cir
Your Personal Tour Guide
Ask me questions while you tour the home.