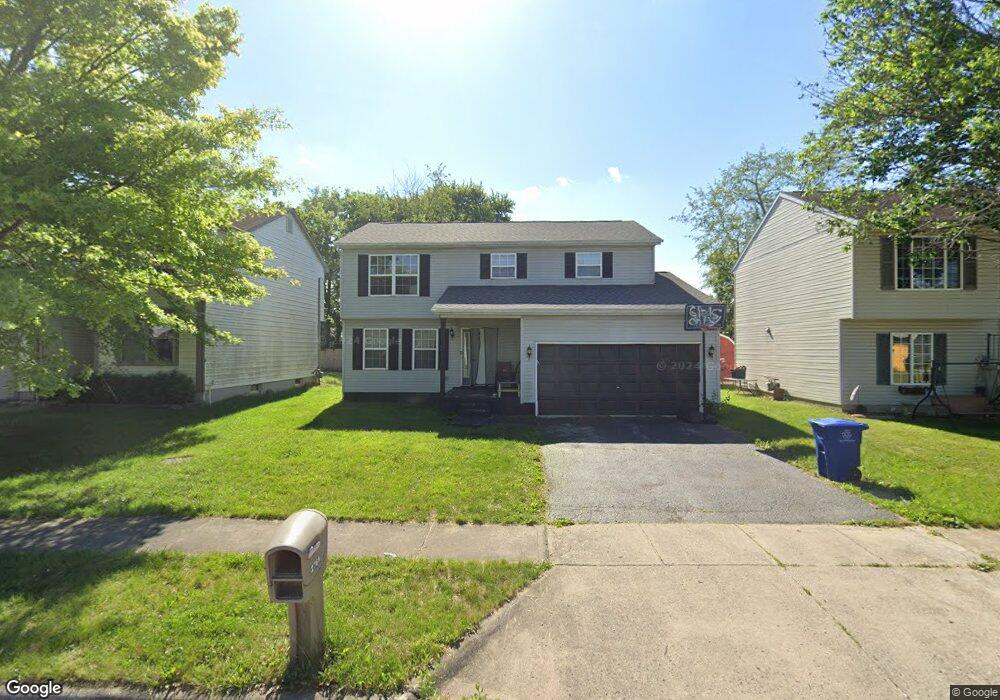
2765 Raphael Dr Columbus, OH 43232
Walnut Heights NeighborhoodEstimated Value: $224,000 - $299,000
4
Beds
3
Baths
1,754
Sq Ft
$154/Sq Ft
Est. Value
About This Home
This home is located at 2765 Raphael Dr, Columbus, OH 43232 and is currently estimated at $269,620, approximately $153 per square foot. 2765 Raphael Dr is a home located in Franklin County with nearby schools including Liberty Elementary School, Yorktown Middle School, and Independence High School.
Ownership History
Date
Name
Owned For
Owner Type
Purchase Details
Closed on
Aug 10, 2011
Sold by
Hsbc Mortgage Services Inc
Bought by
Mock Leticia D
Current Estimated Value
Home Financials for this Owner
Home Financials are based on the most recent Mortgage that was taken out on this home.
Original Mortgage
$81,214
Interest Rate
4.75%
Mortgage Type
FHA
Purchase Details
Closed on
Apr 14, 2011
Sold by
Brown Sonja L and Case #10 Cve 04 05096
Bought by
Hsbc Mortgage Services Inc
Purchase Details
Closed on
May 1, 1996
Sold by
Columbus Contractor Co
Bought by
Sonja L Brown
Home Financials for this Owner
Home Financials are based on the most recent Mortgage that was taken out on this home.
Original Mortgage
$111,400
Interest Rate
7.86%
Mortgage Type
FHA
Create a Home Valuation Report for This Property
The Home Valuation Report is an in-depth analysis detailing your home's value as well as a comparison with similar homes in the area
Home Values in the Area
Average Home Value in this Area
Purchase History
| Date | Buyer | Sale Price | Title Company |
|---|---|---|---|
| Mock Leticia D | $70,000 | Omega Titl | |
| Hsbc Mortgage Services Inc | $80,000 | None Available | |
| Sonja L Brown | $112,140 | -- |
Source: Public Records
Mortgage History
| Date | Status | Borrower | Loan Amount |
|---|---|---|---|
| Previous Owner | Mock Leticia D | $81,214 | |
| Previous Owner | Sonja L Brown | $111,400 |
Source: Public Records
Tax History
| Year | Tax Paid | Tax Assessment Tax Assessment Total Assessment is a certain percentage of the fair market value that is determined by local assessors to be the total taxable value of land and additions on the property. | Land | Improvement |
|---|---|---|---|---|
| 2025 | $3,690 | $82,220 | $16,980 | $65,240 |
| 2024 | $3,690 | $82,220 | $16,980 | $65,240 |
| 2023 | $3,643 | $82,215 | $16,975 | $65,240 |
| 2022 | $2,650 | $51,100 | $5,250 | $45,850 |
| 2021 | $2,879 | $51,100 | $5,250 | $45,850 |
| 2020 | $2,701 | $51,100 | $5,250 | $45,850 |
| 2019 | $2,580 | $42,530 | $4,380 | $38,150 |
| 2018 | $2,332 | $42,530 | $4,380 | $38,150 |
| 2017 | $2,441 | $42,530 | $4,380 | $38,150 |
| 2016 | $2,303 | $34,760 | $6,020 | $28,740 |
| 2015 | $2,090 | $34,760 | $6,020 | $28,740 |
| 2014 | $2,095 | $34,760 | $6,020 | $28,740 |
| 2013 | $1,148 | $38,605 | $6,685 | $31,920 |
Source: Public Records
Map
Nearby Homes
- 2730 Raphael Dr
- 2700 Raphael Dr
- 2706 Moundcrest St
- 2744 Barrows Rd
- 2736 Barrows Rd
- 5278 Glenbriar Ct
- 5326 Adderley Ave
- 2651 Brownfield Rd
- 2900 Gentry Ln
- 5414 Paladim Rd
- 2608 Hubbell Rd
- 5137 Holbrook Dr
- 5373 Spire Ln
- 5290 Quincy Dr
- 2998 Osgood Rd E
- 5882 Abernathy Ln Unit 5882F
- 5114 Carbondale Dr
- 5944 Abernathy Ln
- 5123 Jameson Dr
- 5946 Abernathy Ln
- 2771 Raphael Dr
- 2759 Raphael Dr
- 2777 Raphael Dr
- 2772 Millvale St
- 5429 Monfort Ave
- 2780 Millvale St
- 2783 Raphael Dr
- 2766 Raphael Dr
- 2760 Raphael Dr
- 2772 Raphael Dr
- 2788 Millvale St
- 2743 Raphael Dr
- 2754 Raphael Dr
- 2778 Raphael Dr
- 2789 Raphael Dr
- 5438 Monfort Ave
- 2748 Raphael Dr
- 2796 Millvale St
- 2784 Raphael Dr
- 5430 Monfort Ave
Your Personal Tour Guide
Ask me questions while you tour the home.