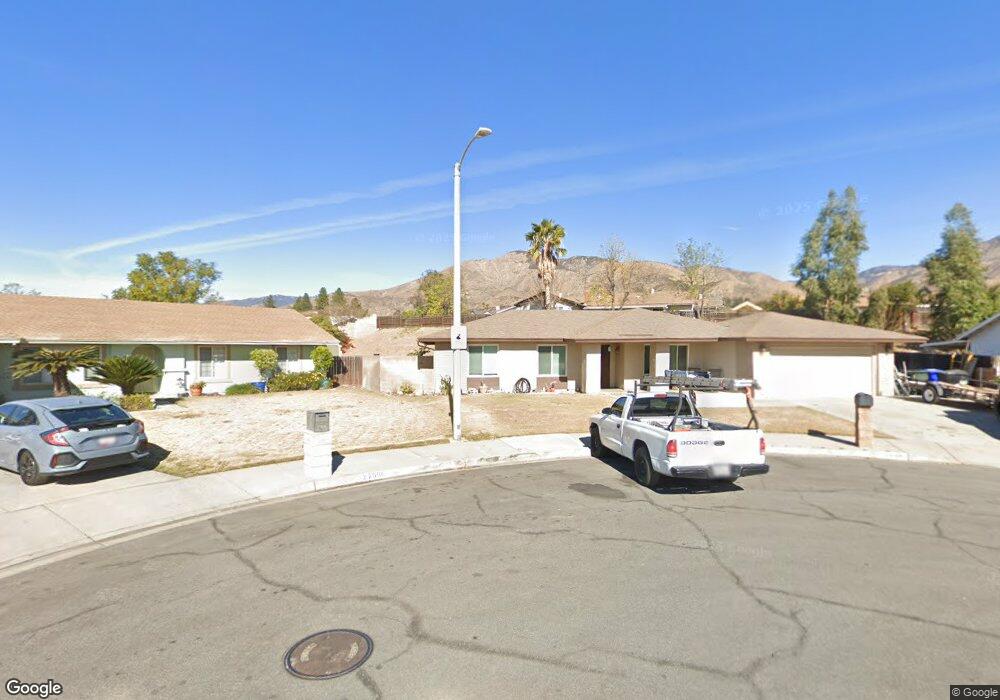
27666 Rainbow Ct Highland, CA 92346
Crossroads NeighborhoodEstimated Value: $526,000 - $558,734
4
Beds
2
Baths
1,766
Sq Ft
$307/Sq Ft
Est. Value
About This Home
This home is located at 27666 Rainbow Ct, Highland, CA 92346 and is currently estimated at $541,434, approximately $306 per square foot. 27666 Rainbow Ct is a home located in San Bernardino County with nearby schools including Bonnie Oehl Elementary School, Serrano Middle School, and San Gorgonio High School.
Ownership History
Date
Name
Owned For
Owner Type
Purchase Details
Closed on
Feb 23, 2011
Sold by
Aurora Loan Services Llc
Bought by
Mendieta Rosalie R
Current Estimated Value
Home Financials for this Owner
Home Financials are based on the most recent Mortgage that was taken out on this home.
Original Mortgage
$155,540
Interest Rate
4.75%
Mortgage Type
FHA
Purchase Details
Closed on
Jan 12, 2011
Sold by
Johnson Terry Ross
Bought by
Aurora Loan Services Llc
Home Financials for this Owner
Home Financials are based on the most recent Mortgage that was taken out on this home.
Original Mortgage
$155,540
Interest Rate
4.75%
Mortgage Type
FHA
Purchase Details
Closed on
Feb 27, 2007
Sold by
Va
Bought by
Johnson Terry Ross and Johnson Judy
Home Financials for this Owner
Home Financials are based on the most recent Mortgage that was taken out on this home.
Original Mortgage
$308,000
Interest Rate
6.87%
Mortgage Type
Negative Amortization
Purchase Details
Closed on
Sep 12, 1995
Sold by
Simpson Norman W
Bought by
Va
Create a Home Valuation Report for This Property
The Home Valuation Report is an in-depth analysis detailing your home's value as well as a comparison with similar homes in the area
Home Values in the Area
Average Home Value in this Area
Purchase History
| Date | Buyer | Sale Price | Title Company |
|---|---|---|---|
| Mendieta Rosalie R | $174,000 | Lsi Title Company | |
| Aurora Loan Services Llc | $337,971 | Accommodation | |
| Johnson Terry Ross | -- | Orange Coast Title | |
| Va | $118,000 | Chicago Title Co |
Source: Public Records
Mortgage History
| Date | Status | Borrower | Loan Amount |
|---|---|---|---|
| Previous Owner | Mendieta Rosalie R | $155,540 | |
| Previous Owner | Johnson Terry Ross | $308,000 |
Source: Public Records
Tax History
| Year | Tax Paid | Tax Assessment Tax Assessment Total Assessment is a certain percentage of the fair market value that is determined by local assessors to be the total taxable value of land and additions on the property. | Land | Improvement |
|---|---|---|---|---|
| 2025 | $3,148 | $222,926 | $76,870 | $146,056 |
| 2024 | $3,081 | $218,555 | $75,363 | $143,192 |
| 2023 | $3,014 | $214,269 | $73,885 | $140,384 |
| 2022 | $3,012 | $210,067 | $72,436 | $137,631 |
| 2021 | $2,975 | $205,948 | $71,016 | $134,932 |
| 2020 | $2,968 | $203,836 | $70,288 | $133,548 |
| 2019 | $2,867 | $199,839 | $68,910 | $130,929 |
| 2018 | $2,768 | $195,921 | $67,559 | $128,362 |
| 2017 | $2,438 | $192,079 | $66,234 | $125,845 |
| 2016 | $2,364 | $188,312 | $64,935 | $123,377 |
| 2015 | $2,406 | $185,484 | $63,960 | $121,524 |
| 2014 | $2,339 | $181,851 | $62,707 | $119,144 |
Source: Public Records
Map
Nearby Homes
- 0 La Praix St
- 3850 Atlantic Ave Unit 287
- 3850 Atlantic Ave Unit 158
- 3850 Atlantic Ave Unit 151
- 3850 Atlantic Ave Unit 189
- 3850 Atlantic Ave Unit 152
- 3850 E Atlantic Unit 284
- 1614 Buckeye St
- 1634 Seine Ave
- 1584 Buckeye St
- 3734 Pacific St Unit 40
- 2004 Palm Ave
- 6986 Church Ave
- 28046 Millar St
- 2035 Reedy Ave
- 1911 Reedy Ave
- 2794 La Praix St
- 7001 Church Ave Unit 15
- 2549 Bonita Dr
- 27989 Pacific St
- 27660 Rainbow Ct
- 27679 19th Ct
- 27676 Rainbow Ct
- 27685 19th Ct
- 27675 19th Ct
- 27661 Rainbow Ct
- 27677 Rainbow Ct
- 27669 Rainbow Ct
- 27672 19th Ct
- 6655 La Praix St
- 6667 La Praix St
- 6645 La Praix St
- 27678 19th Ct
- 6635 La Praix St
- 6687 La Praix St
- 27686 19th Ct
- 6666 Seine Ave
- 6625 La Praix St
- 27600 Atlantic Space 431 Ave Unit 431
- 27600 Atlantic Ave Unit 446
Your Personal Tour Guide
Ask me questions while you tour the home.