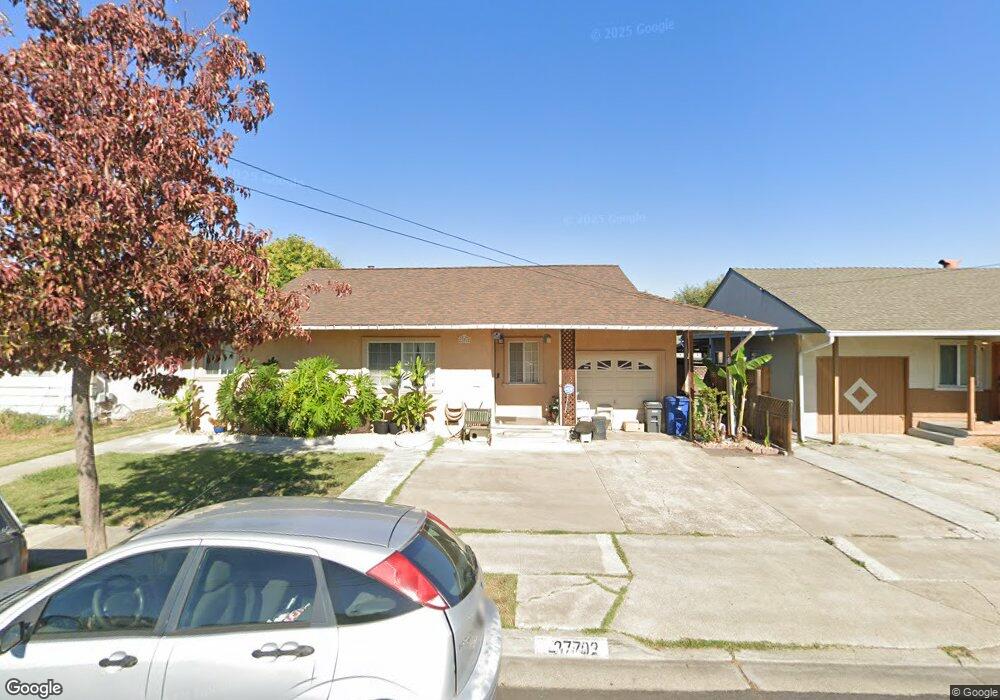
27702 Bruno St Hayward, CA 94544
Harder-Tennyson NeighborhoodEstimated Value: $577,628 - $770,000
3
Beds
1
Bath
927
Sq Ft
$743/Sq Ft
Est. Value
About This Home
This home is located at 27702 Bruno St, Hayward, CA 94544 and is currently estimated at $689,157, approximately $743 per square foot. 27702 Bruno St is a home located in Alameda County with nearby schools including Eldridge Elementary School, Martin Luther King, Jr. Middle School, and Tennyson High School.
Ownership History
Date
Name
Owned For
Owner Type
Purchase Details
Closed on
Jul 14, 2016
Sold by
Simon Ululani
Bought by
Simon Ululani F and Ululani F Simon Trust
Current Estimated Value
Purchase Details
Closed on
May 27, 2003
Sold by
Simon Ululani and Simon Isabella
Bought by
Simon Ululani
Home Financials for this Owner
Home Financials are based on the most recent Mortgage that was taken out on this home.
Original Mortgage
$214,500
Outstanding Balance
$93,757
Interest Rate
5.75%
Mortgage Type
Stand Alone First
Estimated Equity
$595,400
Purchase Details
Closed on
Oct 6, 1999
Sold by
Simon Isabella G and Simon Ululan
Bought by
Simon Ululani and Simon Isabella
Home Financials for this Owner
Home Financials are based on the most recent Mortgage that was taken out on this home.
Original Mortgage
$131,000
Interest Rate
7.77%
Purchase Details
Closed on
Sep 26, 1996
Sold by
Simon Santiago and Simon Isabella
Bought by
Gonzales Simon Santiago and Gonzales Simon Isabella
Purchase Details
Closed on
Jul 29, 1994
Sold by
Simon Santiago and Simon Isabella
Bought by
Simon Santiago and Simon Isabella
Create a Home Valuation Report for This Property
The Home Valuation Report is an in-depth analysis detailing your home's value as well as a comparison with similar homes in the area
Home Values in the Area
Average Home Value in this Area
Purchase History
| Date | Buyer | Sale Price | Title Company |
|---|---|---|---|
| Simon Ululani F | -- | None Available | |
| Simon Ululani | $107,500 | Alliance Title Company | |
| Simon Ululani | -- | First American Title | |
| Gonzales Simon Santiago | -- | -- | |
| Simon Santiago | -- | -- |
Source: Public Records
Mortgage History
| Date | Status | Borrower | Loan Amount |
|---|---|---|---|
| Open | Simon Ululani | $214,500 | |
| Closed | Simon Ululani | $131,000 |
Source: Public Records
Tax History Compared to Growth
Tax History
| Year | Tax Paid | Tax Assessment Tax Assessment Total Assessment is a certain percentage of the fair market value that is determined by local assessors to be the total taxable value of land and additions on the property. | Land | Improvement |
|---|---|---|---|---|
| 2025 | $944 | $48,897 | $25,987 | $29,910 |
| 2024 | $944 | $47,801 | $25,477 | $29,324 |
| 2023 | $931 | $53,727 | $24,978 | $28,749 |
| 2022 | $916 | $45,674 | $24,488 | $28,186 |
| 2021 | $908 | $44,641 | $24,008 | $27,633 |
| 2020 | $900 | $51,112 | $23,762 | $27,350 |
| 2019 | $902 | $50,110 | $23,296 | $26,814 |
| 2018 | $864 | $49,128 | $22,840 | $26,288 |
| 2017 | $850 | $48,165 | $22,392 | $25,773 |
| 2016 | $780 | $47,220 | $21,953 | $25,267 |
| 2015 | $770 | $46,511 | $21,623 | $24,888 |
| 2014 | $744 | $45,599 | $21,199 | $24,400 |
Source: Public Records
Map
Nearby Homes
- 725 Auburn Place Unit 106
- 27894 Andrea St
- 27418 Susan Place Unit 3
- 918 W Tennyson Rd Unit 105
- 27949 Thornton Ct Unit 1B
- 27781 Dickens Ave
- 27906 Thackeray Ave
- 27505 Tampa Ave Unit 15
- 28222 Lustig Ct
- 1029 Cheryl Ann Cir Unit 66
- 1021 Cheryl Ann Cir Unit 62
- 41 Astrida Dr Unit 9
- 32 Astrida Dr Unit 2
- 552 Celia St
- 28315 Rochelle Ave
- 250 Schafer Rd
- 27426 Patrick Ave
- 27628 Pensacola Way
- 399 Schafer Rd
- 1127 Hat Creek Way
- 27674 Bruno St
- 27724 Bruno St
- 27701 Andrea St
- 27670 Bruno St
- 27723 Andrea St
- 27746 Bruno St
- 27693 Andrea St
- 27745 Andrea St
- 27669 Andrea St
- 27768 Bruno St
- 27703 Bruno St
- 584 Brian St
- 27725 Bruno St
- 27675 Bruno St
- 27767 Andrea St
- 27747 Bruno St
- 570 Brian St
- 27671 Bruno St
- 27790 Bruno St
- 27769 Bruno St